Earthquake Hazard Information – Hazard, Risk,
Magnitude, Intensity, Earthquake Statistics – Part 1 (Information for
interpreting the results of building contest and shake table testing; L.
Braile,
Earthquake ground shaking and
damage are related to the size (magnitude) of the earthquake, the distance from
the epicenter, the local geological conditions and the characteristics of
buildings. Assessment of earthquake
effects involves evaluating the hazard
and the risk. Definitions of these two concepts (from the
USGS, http://earthquake.usgs.gov/image_glossary/)
are:
|
|
Earthquake hazard Earthquake risk |
Earthquake Magnitude: Several
magnitude scales have been developed for measuring the size of an
earthquake. Magnitude is a measure of
the energy released by the earthquake.
The earliest magnitude scale was Richter
magnitude and news reports still often refer to magnitudes as Richter
magnitude. However, today, the most
reliable magnitude scale is the moment
magnitude, now referred to simply as M. For well-recorded, shallow, moderate to large
earthquakes, estimates of the earthquake size using the various magnitude
scales usually results in approximately the same numerical result. Current earthquake information, including
magnitude, can be found at: http://earthquake.usgs.gov/
and http://www.iris.edu/seismon/. A more complete description of earthquake
magnitude is given below (from http://neic.usgs.gov/neis/general/handouts/measure.html):
Measuring the
Size of an Earthquake
Earthquakes range broadly in size. A rock-burst in an
Today, state of the art seismic systems transmit data from the
seismograph via telephone line and satellite directly to a central digital
computer. A preliminary location, depth-of-focus, and magnitude can now be
obtained within minutes of the onset of an earthquake. The only limiting factor
is how long the seismic waves take to travel from the epicenter to the stations
- usually less than 10 minutes.
Magnitude
Modern seismographic systems precisely amplify and record ground
motion (typically at periods of between 0.1 and 100 seconds) as a function of
time. This amplification and recording as a function of time is the source of
instrumental amplitude and arrival-time data on near and distant earthquakes.
Although similar seismographs have existed since the 1890's, it was only in the
1930's that Charles F. Richter, a
Richter's original magnitude scale (ML) was then
extended to observations of earthquakes of any distance and of focal depths
ranging between 0 and 700 km. Because earthquakes excite both body waves, which
travel into and through the Earth, and surface waves, which are constrained to
follow the natural wave guide of the Earth's uppermost layers, two magnitude
scales evolved - the mb and MS scales.
The standard body-wave magnitude formula is
mb = log10(A/T) + Q(D,h)
,
where A is the amplitude of ground motion (in microns); T
is the corresponding period (in seconds); and Q(D,h) is a
correction factor that is a function of distance, D (degrees), between
epicenter and station and focal depth, h (in kilometers), of the
earthquake. The standard surface-wave formula is
MS = log10 (A/T) + 1.66 log10
(D) + 3.30 .
There are many variations of these formulas that take into account
effects of specific geographic regions, so that the final computed magnitude is
reasonably consistent with Richter's original definition of ML.
Negative magnitude values are permissible.
A rough idea of frequency of occurrence of large earthquakes is
given by the following table:
MS Earthquakes per year ---------- ----------- 8.5 - 8.9 0.3 8.0 - 8.4 1.1 7.5 - 7.9 3.1 7.0 - 7.4 15 6.5 - 6.9 56 6.0 - 6.4 210
This table is based on data for a recent 47 year period. Perhaps
the rates of earthquake occurrence are highly variable and some other 47 year
period could give quite different results.
The original mb scale utilized compressional body
P-wave amplitudes with periods of 4-5 s, but recent observations are generally
of 1 s-period P waves. The MS scale has consistently used Rayleigh
surface waves in the period range from 18 to 22 s.
When initially developed, these magnitude scales were considered
to be equivalent; in other words, earthquakes of all sizes were thought to
radiate fixed proportions of energy at different periods. But it turns out that
larger earthquakes, which have larger rupture surfaces, systematically radiate
more long-period energy. Thus, for very large earthquakes, body-wave magnitudes
badly underestimate true earthquake size; the maximum body-wave magnitudes are
about 6.5 - 6.8. In fact, the surface-wave magnitudes underestimate the size of
very large earthquakes; the maximum observed values are about 8.3 - 8.7. Some
investigators have suggested that the 100 s mantle Love waves (a type of
surface wave) should be used to estimate magnitude of great earthquakes.
However, even this approach ignores the fact that damage to structure is often
caused by energy at shorter periods. Thus, modern seismologists are
increasingly turning to two separate parameters to describe the physical
effects of an earthquake: seismic moment and radiated energy.
Fault
Geometry and Seismic Moment, MO
The orientation of the fault, direction of fault movement, and
size of an earthquake can be described by the fault geometry and seismic moment.
These parameters are determined from waveform analysis of the seismograms
produced by an earthquake. The differing shapes and directions of motion of the
waveforms recorded at different distances and azimuths from the earthquake are
used to determine the fault geometry, and the wave amplitudes are used to
compute moment. The seismic moment is related to fundamental parameters of the
faulting process.
MO = µS‹d› ,
where µ is the shear strength of the faulted rock, S is the area
of the fault, and <d> is the average displacement on the fault. Because
fault geometry and observer azimuth are a part of the computation, moment is a
more consistent measure of earthquake size than is magnitude, and more
importantly, moment does not have an intrinsic upper bound. These factors have
led to the definition of a new magnitude scale MW, based on seismic
moment, where
MW = 2/3 log10(MO) - 10.7 .
The two largest reported moments are 2.5 X 1030 dyn·cm
(dyne·centimeters) for the 1960
Energy,
E
The amount of energy radiated by an earthquake is a measure of the
potential for damage to man-made structures. Theoretically, its computation
requires summing the energy flux over a broad suite of frequencies generated by
an earthquake as it ruptures a fault. Because of instrumental limitations, most
estimates of energy have historically relied on the empirical relationship
developed by Beno Gutenberg and Charles Richter:
log10E = 11.8 + 1.5MS
where energy, E, is expressed in ergs. The drawback of this
method is that MS is computed from an bandwidth between
approximately 18 to 22 s. It is now known that the energy radiated by an
earthquake is concentrated over a different bandwidth and at higher
frequencies. With the worldwide deployment of modern digitally recording
seismograph with broad bandwidth response, computerized methods are now able to
make accurate and explicit estimates of energy on a routine basis for all major
earthquakes. A magnitude based on energy radiated by an earthquake, Me,
can now be defined,
Me = 2/3 log10E - 2.9.
For every increase in magnitude by 1 unit, the associated seismic energy
increases by about 32 times.
Although Mw and Me are both magnitudes, they
describe different physical properites of the earthquake. Mw,
computed from low-frequency seismic data, is a measure of the area ruptured by
an earthquake. Me, computed from high frequency seismic data, is a
measure of seismic potential for damage. Consequently, Mw and Me
often do not have the same numerical value.
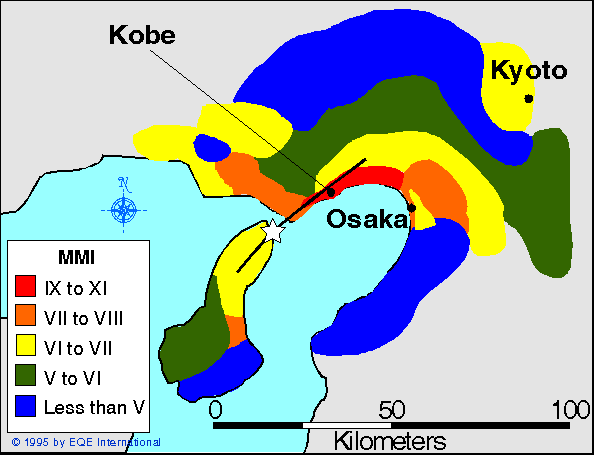
Intensity
The increase in the degree of surface shaking (intensity) for each
unit increase of magnitude of a shallow crustal earthquake is unknown.
Intensity is based on an earthquake's local accelerations and how long these
persist. Intensity and magnitude thus both depend on many variables that
include exactly how rock breaks and how energy travels from an earthquake to a
receiver. These factors make it difficult for engineers and others who use
earthquake intensity and magnitude data to evaluate the error bounds that may
exist for their particular applications.
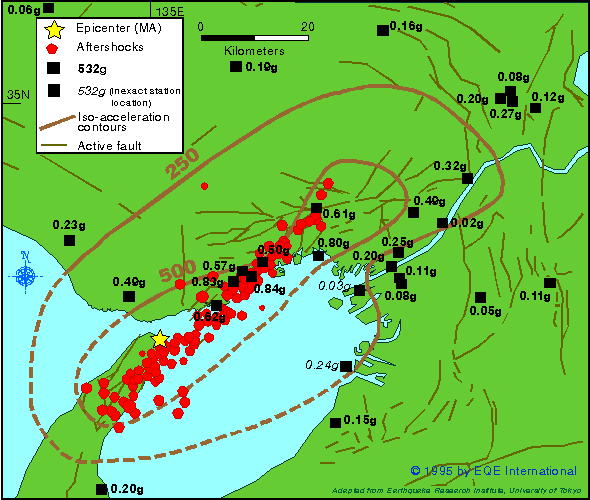
An example of how local soil conditions can greatly influence
local intensity is given by catastrophic damage in
The occurrence of an earthquake is a complex physical process.
When an earthquake occurs, much of the available local stress is used to power
the earthquake fracture growth to produce heat rather that to generate seismic
waves. Of an earthquake system's total energy, perhaps 10 percent to less that
1 percent is ultimately radiated as seismic energy. So the degree to which an
earthquake lowers the Earth's available potential energy is only fractionally
observed as radiated seismic energy.
by William Spence, Stuart A.
Sipkin, and George L. Choy
Earthquakes and Volcanoes
Volume 21, Number 1, 1989
Earthquake
intensity (usually described with the Modified Mercalli Intensity Scale) is a
measure of earthquake effects and level of ground shaking at a particular
location. A description of earthquake
intensity is given below (from http://neic.usgs.gov/neis/general/handouts/mercalli.html):
The Modified
Mercalli Intensity Scale
The
effect of an earthquake on the Earth's surface is called the intensity. The
intensity scale consists of a series of certain key responses such as people
awakening, movement of furniture, damage to chimneys, and finally - total
destruction. Although numerous intensity scales have been developed over
the last several hundred years to evaluate the effects of earthquakes, the one
currently used in the
The
Modified Mercalli Intensity value assigned to a specific site after an
earthquake has a more meaningful measure of severity to the nonscientist than
the magnitude because intensity refers to the effects actually experienced at
that place. After the occurrence of widely-felt earthquakes, the Geological
Survey mails questionnaires to postmasters in the disturbed area requesting the
information so that intensity values can be assigned. The results of this
postal canvass and information furnished by other sources are used to assign an
intensity within the felt area. The maximum observed intensity generally occurs
near the epicenter.
The lower
numbers of the intensity scale generally deal with the manner in which the
earthquake is felt by people. The higher numbers of the scale are based
on observed structural damage. Structural engineers usually contribute
information for assigning intensity values of VIII or above.
The
following is an abbreviated description of the 12 levels of Modified Mercalli
intensity.
I.
Not felt except by a very few under especially favorable conditions.
II.
Felt only by a few persons at rest, especially on upper floors of buildings.
III.
Felt quite noticeably by persons indoors, especially on upper floors of
buildings. Many people do not recognize it as an earthquake. Standing motor
cars may rock slightly. Vibrations similar to the passing of a truck. Duration
estimated.
IV.
Felt indoors by many, outdoors by few during the day. At night, some awakened.
Dishes, windows, doors disturbed; walls make cracking sound. Sensation like
heavy truck striking building. Standing motor cars rocked noticeably.
V.
Felt by nearly everyone; many awakened. Some dishes, windows broken. Unstable
objects overturned. Pendulum clocks may stop.
VI.
Felt by all, many frightened. Some heavy furniture moved; a few instances of
fallen plaster. Damage slight.
VII.
Damage negligible in buildings of good design and construction; slight to
moderate in well-built ordinary structures; considerable damage in poorly built
or badly designed structures; some chimneys broken.
VIII.
Damage slight in specially designed structures; considerable damage in ordinary
substantial buildings with partial collapse. Damage great in poorly built
structures. Fall of chimneys, factory stacks, columns, monuments, walls. Heavy
furniture overturned.
IX.
Damage considerable in specially designed structures; well-designed frame
structures thrown out of plumb. Damage great in substantial buildings, with
partial collapse. Buildings shifted off foundations.
X. Some
well-built wooden structures destroyed; most masonry and frame structures
destroyed with foundations. Rails bent.
XI.
Few, if any (masonry) structures remain standing. Bridges destroyed. Rails bent
greatly.
XII.
Damage total. Lines of sight and level are distorted. Objects thrown into the
air.
Abridged from The Severity of an Earthquake, a
This
publication is one of a series of general interest
publications prepared by the U.S. Geological Survey to provide information
about the earth sciences, natural resources, and the environment. To obtain a
catalog of additional titles in the series "General Interest Publications
of the U.S. Geological Survey," write:
Information Services
Box 25286
Denver, CO 80225
Earthquake Facts and Statistics (from http://neic.usgs.gov/neis/eqlists/eqstats.html)
Frequency of Occurrence of Earthquakes
Based on Observations since 1900
|
Descriptor |
Magnitude |
Average Annually |
|
Great |
8 and higher |
1 |
|
Major |
7 - 7.9 |
18 |
|
Strong |
6 - 6.9 |
120 |
|
Moderate |
5 - 5.9 |
800 |
|
Light |
4 - 4.9 |
6,200 (estimated) |
|
Minor |
3 - 3.9 |
49,000 (estimated) |
|
Very Minor |
< 3.0 |
Magnitude 2 - 3: about 1,000 per day |
The
USGS estimates that several million earthquakes occur in the world each year.
Many go undetected because they hit remote areas or have very small magnitudes.
The NEIC now locates about 50 earthquakes each day, or about 20,000 a year.
Number of Earthquakes Worldwide for 1990 - 2002
Located by the
|
Number of Earthquakes in the
Located by the
|
Red values indicate the earthquakes occurred in
Blue values indicate the
earthquakes occurred in
* As of
Earthquakes Located by the
USGS NEIC 1980-1989.
Earthquakes Located by the
USGS NEIC 1970-1979.
As
more and more seismographs are installed in the world, more earthquakes can be
and have been located. However, the number of large earthquakes (magnitude 6.0
or greater) have stayed relatively constant.
TABLE 4 - Magnitude vs. Ground Motion and
Energy
|
TABLE
4 shows, for example, that a magnitude 7.2 earthquake produces 10 times more ground
motion that a magnitude 6.2 earthquake, but it releases about 32 times more
energy. The energy release best indicates the destructive power of an
earthquake.
Another example:
How much bigger is a
magnitude 9.7 earthquake than a 6.8 earthquake?
A magnitude
9.7 earthquake is 794 times BIGGER on a seismogram than a magnitude 6.8
earthquake. The magnitude scale is logarithmic, so
(10**9.7)/(10**6.8) = (5.01*10**9)/(6.31*10**6) = .794*10**3 = 794 OR = 10**(9.7-6.8) = 10**2.9 = 794.328 Another
way to get about the same answer without using a calculator is that since 1
unit of magnitude is 10 times the amplitude on a seismogram and 0.1 unit of
magnitude is about 1.3 times the amplitude, we can get,
10 * 10 * 10 / 1.3 = 769 times [not exact, but a decent approximation]
The
magnitude scale is really comparing amplitudes of waves on a seismogram, not
the STRENGTH (energy) of the quakes. So, a magnitude 9.7 is 794 times bigger
than a 6.8 quake as measured on seismograms, but the 9.7 quake is about 23,000
times STRONGER than the 6.8! Since it is really the energy or strength that
knocks down buildings, this is really the more important comparison. This means
that it would take about 23,000 quakes of magnitude 6.8 to equal the energy
released by one magnitude 9.7 event. Here's how we get that number:
One
whole unit of magnitude represents approximately 32 times (actually 10**1.5
times) the energy, based on a long-standing empirical formula that says log(E)
is proportional to 1.5M, where E is energy and M is magnitude. This means that
a change of 0.1 in magnitude is about 1.4 times the energy release. Therefore,
using the shortcut shown eartlier for the amplitude calculation, the energy is,
32 * 32 * 32 / 1.4 = 23,405 or about 23,000 The
actual formula would be:
((10**1.5)**9.7)/((10**1.5)**6.8) = 10**(1.5*(9.7-6.8)) = 10**(1.5*2.9) = 22,387 This explains why big quakes are so much more devastating than
small ones. The amplitude ("size") differences are big enough, but
the energy ("strength") differences are huge. The amplitude numbers
are neater and a little easier to explain, which is why those are used more
often in publications. But it's the energy that does the damage.
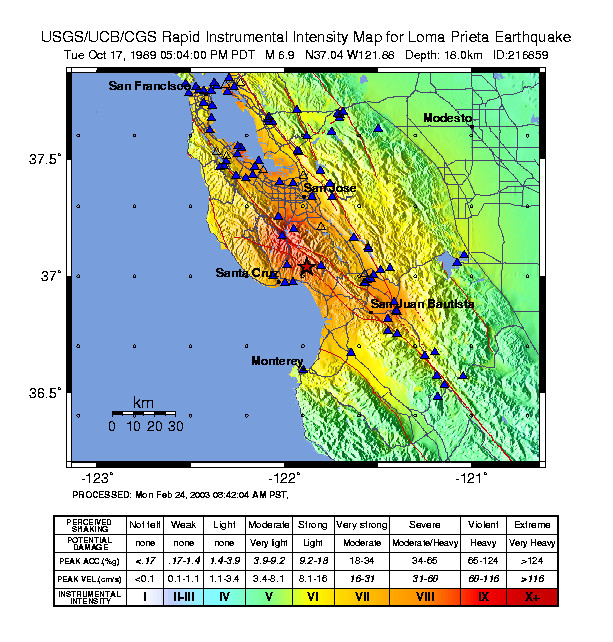
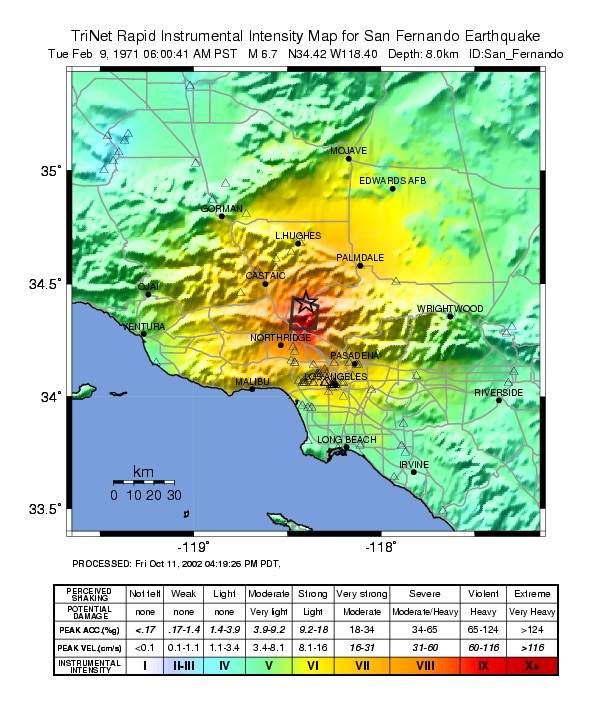
Maps of intensity of ground
shaking can be prepared for specific earthquakes. Today, color maps are prepared very quickly for
significant events from predictions based on the earthquake location and
magnitude or from reports of ground shaking (“felt reports”) and the maps
displayed on the USGS web page (http://earthquake.usgs.gov/shakemap/). Examples of these shake maps for the
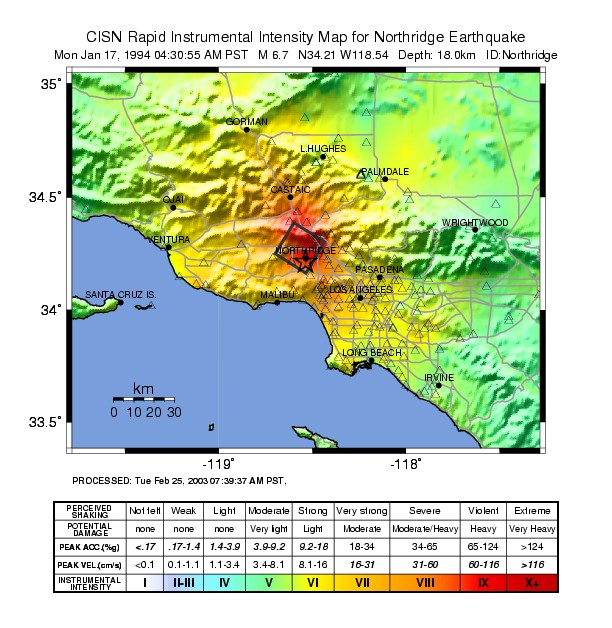
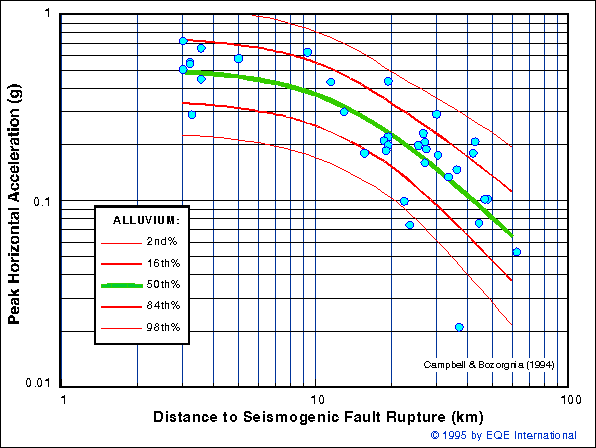
A map of peak ground accelerations, an
acceleration versus distance plot and an intensity map for the January 17, 1995