|
|
Purdue University braile@purdue.edu
|
|
|
|
Purdue University braile@purdue.edu
|
|

EAS 509 Home Page:
http://web.ics.purdue.edu/~braile/eas509/eas509home.htm
Prof. Lawrence W. Braile
Department of Earth and Atmospheric Sciences
Purdue University
West Lafayette, IN 47907-1397
Last updated: November 15, 2003
Matlab Codes (click on any of the following files to download; save in your Matlab work folder; see EAS 509 notes for additional information, program listings and examples):
Least squares files:
linfit.m – least squares straight line calculation using Cramer’s rule
Spectral analysis, Fourier analysis, filtering files:
ConvolutionTool.m – Demo of convolution (will run on Matlab Student Edition and
Student Version)
TransformTool.m – Demo of Fourier transform/spectral analysis (will run on Matlab
Student Edition and Student Version)
FilterTool.m – Demo of filtering using butterworth filter (requires Matlab Signal
Processing Toolbox in Full version or Student Version; see Matlab codes butter
and filtfilt)
signal.m needed by ConvolutionTool, TransformTool and FilterTool
ricker.m needed by ConvolutionTool, TransformTool and FilterTool
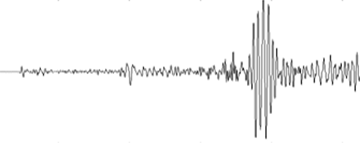
Calculate an plot spectrum of seismogram
NNAz1.txt – Seismogram data needed for PltWilber codes
Two-Dimensional data processing and display:
GridandPlotIllinoisMagneticsData.m
RandGridDataIllinoisMagnetics.m
One-Dimensional Interpolation:
EAS 509 Data Source Links: