Return to L. Braile’s Home Page
braile@purdue.edu
Earth Science Education
Activitiesã: Prof.
Larry Braile
|
|
|

New! You can use Quick Links (a more concise and
organized list, recently updated) to these files for browser viewing (html
files) or download MS Word documents of the activities at: http://web.ics.purdue.edu/~braile/indexlinks/educ.htm.
To view the following Earth science teaching lesson
plans, click on the Title. To print a
copy, select the pdf (Adobe Acrobat; you can obtain a
free copy of Adobe Acrobat Reader by downloading from www.adobe.com)
version. Because of the graphics files,
some of the documents are quite large and make take some time to download or to
view as pdf documents. The largest files are over 14MB in size. If you have trouble opening this page with
Internet Explorer, try Firefox. Most
files are best viewed with Internet Explorer.
|
|
|
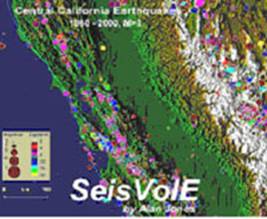
Inquiry-based teaching modules (under development) that use the earthquake and volcano mapping software, Seismic/Eruption (also called SeisVolE; written by Alan Jones), to teach about earthquake and volcanic activity and related plate tectonics. The modules are designed for use in grades 7 – 12 (the grades that include most of the Earth science curriculum in US schools), although they can easily be adapted for use at the middle school level (grades 5 – 6) or at the introductory college level. |
|
|
Updated – New Modules in 2008 |
Teaching modules and resources for using the AS-1 seismograph and the AmaSeis software for earthquake and seismology education. Topics include installing and operating an AS-1 seismograph, using the AmaSeis software (including using the software without an AS-1 seismograph), calculating magnitudes, locating earthquakes using the S minus P method, analyzing and interpreting seismograms, etc. |
|
|
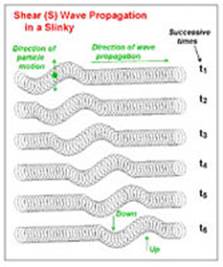
Seismic Waves and the Slinky:
A Guide for Teachers |
A teachers guide designed to introduce the concepts of waves and seismic waves that propagate within the Earth, and to provide ideas and suggestions for how to teach about seismic waves. Includes activities on elasticity, demonstrating seismic wave types with the Slinky, water waves in a wave tank, wave velocity, and the Human wave demonstration. |
|
|
Seismic Waves and the
Slinky: 4-page Lesson Plan/Handout |
A four-page version of the Seismic Waves and the Slinky teacher’s guide. Word (.doc) and pdf versions are also available. The Word of pdf versions can be printed in color or black and white and then copied onto both sides of 11x17 inch paper and folded to make a convenient and useful handout such as to accompany a slinky. |
|
|
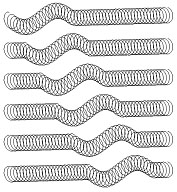
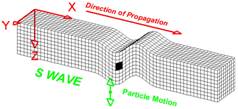
New |
Wave propagation animations. 3-D animations of P, S, Rayleigh and Love wave propagation that allow visualization of seismic wave propagation characteristics and particle motion of the different wave types. Animated gifs can be downloaded to your computer. |
|
|
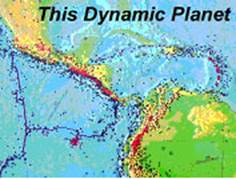
Plate Puzzle
Updated 10/15/06 |
An inquiry-based activity using the map “This Dynamic Planet” to teach about plate tectonics, the distribution and motion of the Earth’s lithospheric plates, the locations of earthquakes and volcanoes, plate boundaries, and hotspots. |
|
|
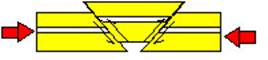
Teaching About Plate
Tectonics and Faulting with Foam Models |
Demonstrate plate tectonic principles, plate boundary interactions and the geometry and relative motions of faulting of geologic layers using 3-D foam models. |
|
|
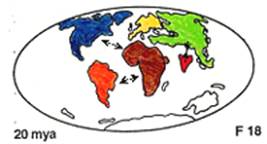
Voyage Through Time – A
Plate Tectonics Flip Book |
View the breakup of the supercontinent Pangea over the past 190 million years and continental drift, and chart the subsequent movement of land masses using a plate tectonics flip book. |
|
|
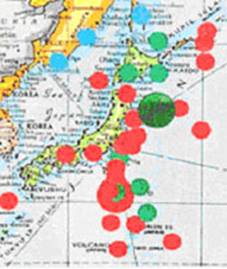
Plotting Earthquake
Epicenters |
Create a plot of worldwide earthquake epicenters to display the narrow zones of seismic activity and aid in the understanding of plate tectonics. Epicenters are plotted on a small world map or a wall map. Earthquake data are obtained from the Internet. Extensions for plotting earthquake locations on the computer are described. |
|
|
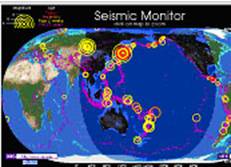
Updated |
A description of Internet-based tools for accessing current, recent and historical earthquake data (location, origin time and magnitude). Examples of tools are provided. |
|
|
|
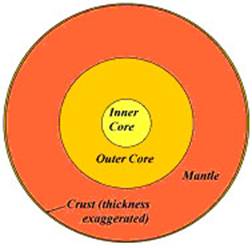
Construct a 3-D model of the Earth to emphasize the (surprising) relative volumes of the main layers (spherical shells) of the Earth – crust, mantle, outer core and inner core. The activity includes a problem solving exercise for estimating volume (separating a sphere of clay into specific volumes corresponding to the relative volumes of the Earth’s crust, mantle, outer core and inner core). |
|
|
|
Develop an understanding of the structure of the Earth’s Interior by constructing a scale model of a “slice” of the interior of the Earth and study the material properties of the Earth’s interior. |
|
|
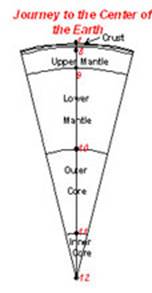
Journey to the Center of the
Earth Updated |
Take a virtual Journey to the Center of the Earth using a scale model of the depths to major features in the Earth’s interior. Learn about the Earth’s internal structure, composition, material properties and conditions. A two-page “Tour Guide” is also provided that can be used to make a small brochure that can be copied and given to each student. A template for making a construction paper “hardhat” for the tour is also included. A narrative is provided for the tour leader. Suggested connections to Jules Verne’s book, A Journey to the Center of the Earth, and the 1959 movie Journey to the Center of the Earth, are provided. |
|
|
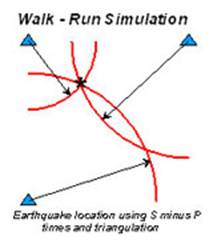
Walk - Run Activity – An S and P Wave Travel Time
Simulation |
Use walking and running speeds and travel times to simulate the S minus P travel time earthquake location method. Travel time curves are determined by measuring speeds of walking and running. A hypothetical earthquake epicenter is calculated by triangulation. The method can be performed outdoors or in a classroom. |
|
|
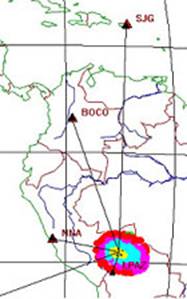
Updated 11/11/04 |
EqLocate is an interactive earthquake location program that uses actual seismograms and user-selected P-wave arrival times to locate the earthquake. The program uses a method that is similar to the approach that is used by seismologists to routinely determine the location of earthquakes from around the world. The EqLocate program and sample data can be downloaded from Alan Jones’ web site. This tutorial describes how EqLocate works and provides detailed instructions on its use. Additional pre-assembled data sets are also available for download. |
|
|
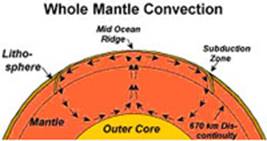
Thermal Convection and
Viscosity of a Fluid |
Explore thermal convection with a simple hands-on activity using vegetable oil in a glass dish. Convection currents in the model are generated by heating the bottom of the dish using a sterno can or candles. The experiment models convection in the Earth’s mantle. Additionally, experiments with the viscosity of fluids develop understanding of the meaning of viscosity and the effect of temperature on viscosity. |
|
|
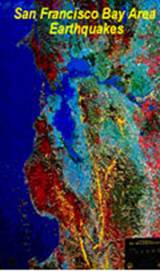
San Francisco Bay Area
Earthquakes |
Learn about earthquake activity, the locations of faults,
and earthquake hazards in the |
|
|
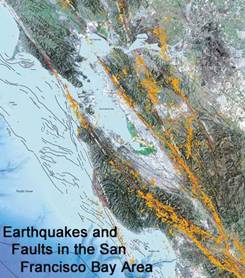
San Francisco Bay Area
Earthquakes (New) New Version - 2007 |
This activity is designed to
provide a better understanding of earthquake activity, the locations of
faults, and earthquake hazards in the |
|
|
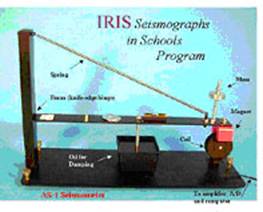
|
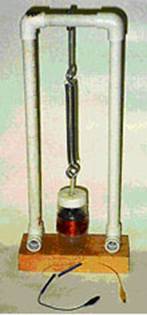
Plans for a simple seismometer that can be used to demonstrate the principles of the electromagnetic seismometer and how shaking of the ground is recorded by a seismograph. Experiments with a magnet and coil assembly illustrate the electromagnetic coupling used in most modern seismographs. Principles of data recording can also be demonstrated. The seismometer uses inexpensive and easy to assemble materials. There are several options for viewing the output from the seismometer. |
|
|
|
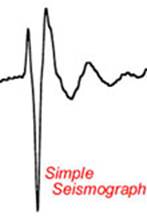
Plans are provided for building a simple seismograph for educational purposes. The seismograph uses homemade and readily available components. It can be attached to a computer for display and analysis. “Stomp test”, “make your own earthquake,” and weight drop experiments for teaching about earthquakes and wave propagation are described. |
|
|
Earth’s Interior – Travel
Times in a Constant Velocity Earth |
This activity provides instructions for comparing the travel times for a simple model of the Earth (a constant seismic velocity Earth) with actual P wave travel times. The travel times from the model can be calculated using a graphical method, using an equation and a calculator, or using a computer program. The results allow one to infer that the Earth’s interior structure must be heterogeneous. |
|
|
Using Earthquake Videos in
the Classroom |
Suggestions for effective use of earthquake videotapes in classroom teaching. An example of a handout to accompany an excellent earthquake video (NOVA series “Earthquake!”) is provided. |
|
|
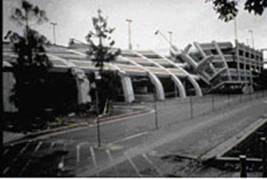
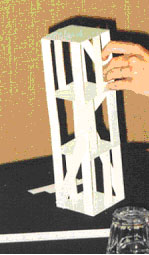
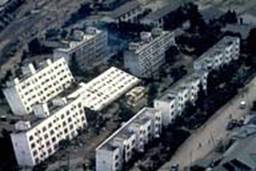
Earthquake Shaking –
Building Contest and Shake Table Testing Updated |
Earthquake risk and the seismic design and construction of buildings is investigated using a building contest in which students build simple model buildings using basic design principles. After construction, the buildings are tested for their resistance to damage during earthquake vibrations using a simple, small, horizontal motion shake table. Comparison with building damage for actual buildings is provided through photographs and other information on the response of real buildings during strong earthquakes. |
|
|
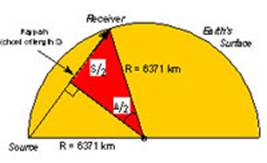
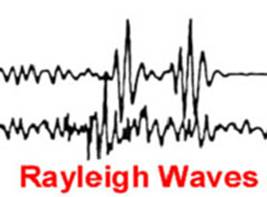
Surface Wave Propagation
Around the Earth - |
Analyze seismograms from the 1989 Loma Prieta earthquake that have been filtered to enhance the long period Rayleigh (surface) wave energy. Using the pattern of arrivals of the Rayleigh waves, infer the paths of the wave propagation determine the seismic wave velocity. |
|
|
The AS-1 Seismograph –
Installation and Calibration Updated |
Instructions for installation of the AS-1 seismograph and the AmaSeis software. Examples of AS-1 recordings are shown. A method of relative calibration of the AS-1 is also provided. |
|
|
The AS-1 Seismograph – Operation,
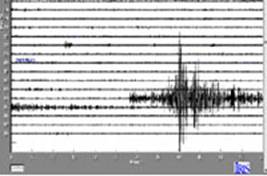
Filtering, S-P Distance Calculation, and Ideas for Classroom Use Updated |
Information on operating the AS-1 seismograph and utilizing the AmaSeis software for filtering and interpreting seismograms, and determining epicenter to station distance. Examples of AS-1 recordings are shown. Ideas for classroom use are also provided. |
|
|
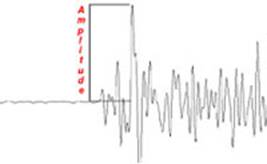
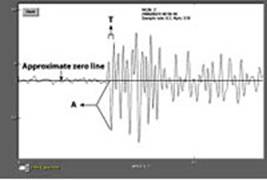
The AS-1 Seismograph – Magnitude
Determination Updated 4/30/06 |
Procedure for determining earthquake magnitude from seismograms from the AS-1 seismograph. Examples of magnitude determination are shown. A comparison of AS-1 magnitudes with “official” magnitude determinations demonstrates that reasonably accurate magnitudes can be determined using AS-1 seismograph data. |
|
|
|
An online magnitude calculator for the AS-1 seismograph and AmaSeis software. By inputting arrival amplitude, wave period and epicenter-to-station distance in degrees, the earthquake magnitude is calculated. Complete documents describing the calculator can also be downloaded in MS Word or PDF format, as well as a version of the calculator that can run locally on your computer. |
|
|
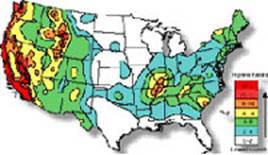
Earthquake Hazard
Information – Hazard, Risk, Magnitude, Intensity, Earthquake Statistics
– Part 1, |
A compilation of information on earthquake hazard, risk, magnitude, intensity and earthquake statistics designed to be used with the building contest activity to interpret the shaking and damage results in terms of actual earthquake damage. Most of the information is from USGS websites. The material is separated into two parts for smaller file size. |
|
|
Earthquake Hazard
Information – Photos of Earthquake Damage, Modes of Building Failure – Part 1, Part 2 |
A compilation of earthquake hazard photos and intensity maps for notable earthquakes designed to be used with the building contest activity to interpret the shaking and damage results in terms of actual earthquake damage. Most of the information is from USGS websites. The material is separated into two parts for smaller file size. |
|
|
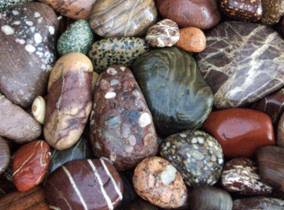
New 10/15/05 |
Make inferences about the geological history of a pebble by observing its characteristics and by utilizing geological principles and concepts. The activity is an excellent follow-up to the study of mineral and rock identification. However, extensive experience with mineral and rock identification is not required. This activity provides practice in observing and critical thinking and opportunities for sketching and creative writing. |
|
|
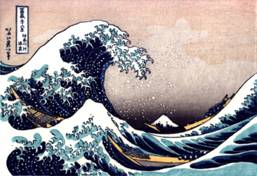
New 3/14/08 |
Tsunami! – Understanding the generation, propagation and hazards of tsunamis (PowerPoint only). This activity illustrates the generation, propagation and hazards of tsunamis through illustrations, photos, animations and videos of actual tsunami (especially the Dec. 26, 2004 Indonesian earthquake and tsunami) and an easy-to-construct model wave tank (illustrated with videos). |
|
|
Science Education – Why
Should We Care? What Can We Do? |
An “essay” on science education, focusing on the K-12 and undergraduate levels, the common perception of the condition of US education, and what scientists, science educators and engineers can (and should) do to help improve science education. |
|
|
Seismology – Resources for
Teachers
|
Latest version of “Resources” document. To make an 8-page brochure, print the pdf version and arrange the pages as shown below (tape pages together on center lines) and photocopy on both sides of two 11” by 17” pieces of paper. Fold on center line to complete brochure.
|


Last
modified May 28, 2010
ã Copyright 2001-2010. L. Braile. Permission granted for reproduction for non-commercial uses.