Using the AS-1 Seismograph and
AmaSeis Software in the Classroom – Recording Earthquakes, Calculating
Magnitude and Epicenter to Station Distance
braile@purdue.edu, http://web.ics.purdue.edu/~braile
![]() 5 minutes
5 minutes
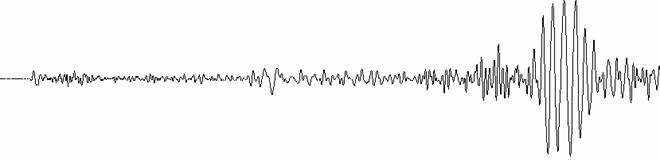
January 22, 2003,
M7.8, Colima, Mexico earthquake recorded on an AS-1 seismograph and AmaSeis
software at West Lafayette, IN. Distance = 26.01 degrees. Seismogram was filtered from 0.001 – 0.1 Hz.
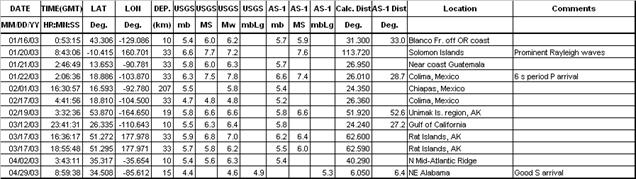
Maintaining a catalog
of recorded earthquakes is a convenient and educational exercise associated
with educational seismograph operation.
Data entries require observation and analysis of seismograms, retrieving
information from the internet and performing simple calculations.
Continuous or short duration (several weeks or months) recording of earthquakes with an educational seismograph is an excellent component of an in-depth science experience that includes record keeping, mathematical calculations and opportunities for significant learning about earthquakes, seismology, plate tectonics and related Earth science. Using the seismograph and recorded seismograms, students can “do science” using their own real data rather than just reading about or listening to descriptions of science. Monitoring earthquakes requires the useful exercises of maintaining an instrument, good record keeping (see example of a portion of an earthquake catalog above), retrieving additional information on the earthquake from the Internet, and making consistent observations of data. Over 3 years of experience with monitoring earthquakes with the AS-1 seismograph demonstrates that even in the relatively low seismicity Midwest or eastern North America, frequent (mostly teleseismic) earthquakes are recorded at relatively quiet sites. Visible earthquake seismograms are present every few days and an event that produces a seismogram that can be used for magnitude or distance calculations occurs, on the average, about once per week. The AmaSeis software (developed by Alan Jones for the AS-1 seismograph with support from IRIS) is easy to use and provides several useful features and tools for archiving, viewing and analyzing data. Exercises that use the recorded earthquake data include determining magnitude and epicenter to station distance. Although the AS-1 is a relatively simple and inexpensive seismograph, the results of these analyses are reasonably accurate (see examples below) thus validating the students’ efforts and increasing the interest in learning. Additional information about the AS-1 seismograph, AS-1 magnitude calculations and using the AS-1/AmaSeis seismograph in educational seismology is contained in the listed website.
Using the AmaSeis travel time curve tool to determine
the epicenter-to-station distance from the S-P arrival times. January 22, 2003, M7.8, Colima, Mexico
earthquake recorded on an AS-1 seismograph and AmaSeis software at West
Lafayette, IN; Distance = 26.01 degrees.
Comparing actual and AS-1/AmaSeis S-P calculated
distances. N = 95; Standard Deviation =
2.29 degrees (April, 2006).
Comparing actual and AS-1/AmaSeis
magnitudes (April, 2006). The AS-1
magnitude calculations result in accurate magnitude determinations. Standard deviations of the differences
between AS-1 (single station) and USGS (average of many stations) magnitudes
are similar to other (standard seismograph) single station uncertainties.
MS Magnitudes: N = 116;
Standard Deviation = 0.25 magnitude units.
mb Magnitudes: N = 229;
Standard Deviation = 0.27 magnitude units.
mbLg Magnitudes: N = 27;
Standard Deviation = 0.34 magnitude units.
Although we cannot calculate Moment Magnitudes (Mw or simply, M) from AS-1 seismograms, the mb, MS and mbLg magnitudes calculated from AS-1 seismograms provide reasonably accurate estimates of Mw. This figure shows the comparison of AS-1 magnitudes (mbLg, mb and MS) with USGS Mw magnitudes.