

Calculating magnitudes from AS-1
seismograms (electronic version)
1
(L. Braile, June,
2004)
1. Introduction: This education module is designed to provide experience with seismograms and calculating magnitudes of earthquakes. The seismograms that are provided were recorded by an AS-1 seismograph and the AmaSeis software. This seismograph system is used in the IRIS Seismographs in Schools program (http://www.iris.edu/about/ENO/). More information about the AS-1 seismograph and the AmaSeis software can be found at http://web.ics.purdue.edu/~braile/ (click on “AS-1 Seismograph Information”). There are two versions of this lesson – one that uses the paper records (printed version) of the seismograms for interpreting and measuring amplitudes to calculate magnitudes, and one that uses the digital copies (electronic version) of the seismograms and the AmaSeis software to help the user interpret the seismograms and measure amplitudes. Of course, to use the electronic version, the user must have access to a Windows computer and have the AmaSeis software installed on the computer. Instructions for downloading, installing and using the AmaSeis software can be found at http://www.iris.edu/about/ENO/AS1AmaSeis.pdf and
http://web.ics.purdue.edu/~braile/edumod/as1lessons/UsingAmaSeis/UsingAmaSeis.htm. In both versions of the calculating
magnitudes lesson the magnitude calculations are performed using the online
AS-1 magnitude calculator MagCalc. If desired, the magnitude calculations can be
performed “by hand” (usually with the help of an electronic calculator) using
the formulas listed in the AS-1 magnitude document http://web.ics.purdue.edu/~braile/edumod/as1mag/as1mag3.htm.
Seismograms are records of ground motion (vibration or shaking of the ground) recorded by seismographs. Thousands of seismograph stations are located around the world to monitor earthquake activity and detect and analyze records of explosions. A world map showing the Global Seismograph Network (GSN) stations and recent earthquake activity can be viewed at http://www.iris.edu/seismon/. Seismograms are used to locate earthquakes, determine the magnitude (size) of earthquakes and explosions, analyze seismic wave propagation, evaluate earthquake hazards, and study the structure of the Earth’s interior.
More information, including examples, on calculating magnitudes from AS-1 seismograms can be found in the online Magnitude Calculator, MagCalc
(http://web.ics.purdue.edu/~braile/edumod/MagCalc/MagCalc.htm) and at
http://web.ics.purdue.edu/~braile/edumod/as1mag/as1mag3.htm. Detailed instructions for using the AmaSeis software are available at
http://web.ics.purdue.edu/~braile/edumod/as1lessons/UsingAmaSeis/UsingAmaSeis.htm and
http://www.scieds.com/spinet/.
In addition to the web version of this document, MS Word and PDF versions are available at:
http://web.ics.purdue.edu/~braile/edumod/as1lessons/magnitude/CalcMagnElect.doc
http://web.ics.purdue.edu/~braile/edumod/as1lessons/magnitude/CalcMagnElect.pdf.
2. Magnitude: The magnitude of an earthquake is a measure
of the size of the earthquake or the energy released. Many magnitude formulas have been developed
over the years. Recently, the Moment
Magnitude (Mw, now usually referred to as just Magnitude or M, such as
for an “M8 earthquake”) formula and method is the preferred estimate and is
routinely reported. Richter magnitude
was defined for
http://web.ics.purdue.edu/~braile/edumod/eqdata/eqdata.htm. The magnitude estimates calculated from AS-1 seismograms are quite accurate as shown by comparisons with official USGS estimates (http://web.ics.purdue.edu/~braile/edumod/MagCalc/AS1Results.htm). More information about earthquake magnitude can be found at the online sites listed in the Introduction and in Bolt (1993, 1999).
To calculate magnitude from AS-1 seismograms, one needs to measure the amplitude (in digital units) of the appropriate phase or arrival (first, P arrival; surface wave; or Lg wave) and the period of the waves. These measurements can be readily obtained from the seismograms using the AmaSeis software (see Using AmaSeis for more details) or by direct measurements from paper copies of the seismograms. An example of amplitude and period measurements is shown in Figure 1 (for the P arrival and the mb magnitude). The epicenter-to-station distance is also required because, for a given magnitude earthquake, the amplitude of wave arrivals decreases with distance from the epicenter. This distance is usually given in geocentric angle (in degrees; for example the geocentric angle for an earthquake at the equator and a station at the North Pole would be 90o; to convert distance in degrees to distance in kilometers along the Earth’s surface, multiply the distance in degrees by 111.19 km/degree). This distance can sometimes be estimated directly from the seismogram using the S minus P arrival time. Alternatively, the distance can be calculated by knowing the locations (latitudes and longitudes) of the epicenter and the seismograph station. For most of the seismograms given below, the distance is provided. The amplitude, period and distance are input to the magnitude calculator (MagCalc) to determine the magnitude. Additional information on calculating distance and on use of the magnitude calculator can be found in the Using AmaSeis document and in MagCalc.
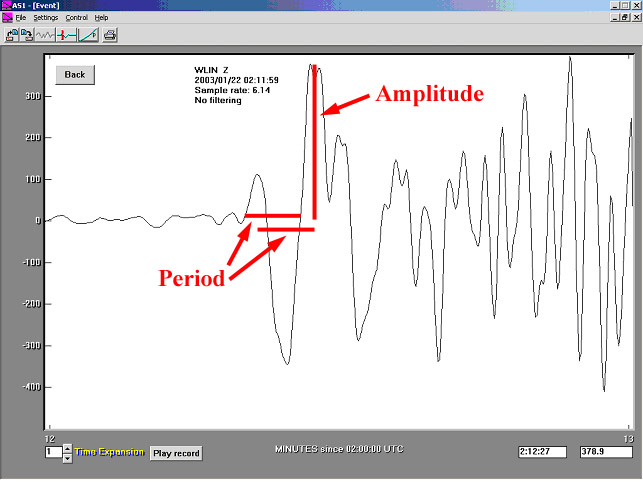
Figure 1. Example of a seismogram (M7.8 Colima,
3. Sample seismograms for
magnitude calculation: Sample
seismograms are provided below for calculation of magnitudes using the AmaSeis software to open, view and enlarge the seismogram,
and measure the amplitude and period.
For the first 6 seismograms, the epicenter-to-station distance is
provided. For the remaining 3
seismograms, the epicenter to station distance can be estimated from the S
minus P time (or calculated from the latitudes and longitudes of the epicenter
and the station). Calculations for the mb, MS and mbLg magnitudes can be
performed using the seismograms listed below. All of the seismograms were
recorded at AS-1 station WLIN (
For one or more seismograms,
download the SAC format seismogram to your computer (click on the appropriate
“.sac” links below, and place in a folder called SAC Files within your AmaSeis Folder). Open the seismogram in the AmaSeis program to view the record. Enlarge the time range of interest (P arrival
for the mb magnitude determination; 20-second surface
wave arrival, commonly the largest of the surface waves, for the MS magnitude
determination; Lg arrival, almost always the largest
arrival for distances of 0-30 degrees for shallow earthquakes, for the mbLg magnitude determination). Use the amplitude tool
(place cursor at the maximum amplitude of the selected phase and read the
amplitude in the window in the lower right hand corner of the screen) to
determine the amplitude. Be sure that
the “zero line” is approximately at zero amplitude; if not the zero-line
amplitude must be subtracted from the amplitude of the maximum signal. The cursor can also be used to measure the
period using either of the approaches illustrated in Figure 1. The times of the two locations on the waves
(see examples in Figure 1; between two peaks or troughs, or 3 successive zero
crossings) can be read from the cursor time window (just left of the amplitude
window) and subtracted to provide an estimate of the wave period. Enter the amplitude, period and distance into
the appropriate magnitude tool in the magnitude calculator (MagCalc) to determine the magnitude estimate for the
recorded earthquake. Compare the
magnitudes that you calculate from the AS-1 seismograms with the official
magnitude (for mb, MS or mbLg
magnitude estimates; Figure 11). Select
some questions (see section 4 below) to answer related to your seismograms and
earthquakes.
3.1.
Body wave
magnitude (mb), Example 1: M7.8 Colima,
http://web.ics.purdue.edu/~braile/edumod/as1lessons/magnitude/Colima30minute.sac
3.2.
Body wave
magnitude (mb), Example 2: M6.5
http://web.ics.purdue.edu/~braile/edumod/as1lessons/magnitude/SanSimeon30minute.sac
3.3.
Surface wave
magnitude (MS), Example 1: M8.1
http://web.ics.purdue.edu/~braile/edumod/as1lessons/magnitude/Hokkaido60minute.sac
3.4.
Surface wave
magnitude (MS), Example 2: M7.2
http://web.ics.purdue.edu/~braile/edumod/as1lessons/magnitude/NewZealand60minute.sac
3.5.
Lg wave magnitude (mbLg), Example 1: M4.4
http://web.ics.purdue.edu/~braile/edumod/as1lessons/magnitude/Evansville5minute.sac
3.6.
Lg wave magnitude (mbLg), Example 2: M4.6
http://web.ics.purdue.edu/~braile/edumod/as1lessons/magnitude/NEAlabama5minute.sac
3.7.
Body wave
magnitude (mb), estimate distance from S minus P
time, Example 1: M6.7
http://web.ics.purdue.edu/~braile/edumod/as1lessons/magnitude/Denali30minute.sac
3.8.
Surface wave
magnitude (MS), estimate distance from S minus P time, Example 1: M6.6
http://web.ics.purdue.edu/~braile/edumod/as1lessons/magnitude/UnimakIsland30minute.sac
3.9.
Body and
surface wave magnitude (mb, MS), estimate distance
from S minus P time, Example 1: M6.8
http://web.ics.purdue.edu/~braile/edumod/as1lessons/magnitude/NAlgeria60minute.sac
4. Questions and extensions: Below are some questions (including some “challenge questions”) and some suggested enrichment activities that are related to seismograms, magnitude and earthquake activity.
4.1. Find the location of your selected earthquakes on a map or globe. What type of plate boundary is present in the areas of the earthquakes?
4.2. Perform a web search to find information about damage for some of the larger earthquakes listed above. What damage and injuries were reported? Why might some moderate sized earthquakes cause significant damage while some very large earthquakes are not associated with significant damage?
4.3. Examine the
4.4. Compare the seismograms for the Colima and San Simeon earthquakes. These earthquakes were approximately the same distance from the seismograph station (WLIN) but had very different magnitudes. What features of the seismograms (position in time of the main arrivals, amplitude and period of the arrivals) are similar? What features are different? Suggest an explanation for your observations.
4.5. Examine the
4.6. Compare the seismograms for
the
4.7. question
for
Delta Time of P S-P TimeDeg M S M S
0.0 0 5.4 0 4.0
0.5 0 10.6 0 7.8
1.0 0 17.7 0 13.5
1.5 0 24.6 0 19.0
2.0 0 31.4 0 24.4
2.5 0 38.3 0 29.9
3.0 0 45.2 0 35.4
3.5 0 52.1 0 40.9
4.0 0 58.9 0 46.4
4.5 1 5.8 0 51.9
5.0 1 12.7 0 57.4
4.8. calculate mb for San Simeon EQ using WLIN and ASAZ. Note very different amplitudes (primarily due to difference in distance) on seismograms. Mb formula accounts for this expected difference. Compare mb calculated from the two stations.
extension/challenge PP,SS etc,
extensions/challenge Spinet (also other M7+)
extensions/challenge find other events
5. Teaching strategies: Teachers can use this teaching module in a variety of ways depending on the background of their students (in the use of computers and experience with earthquake-related information), the availability of computers in the classroom or school, and the amount of time that the teacher wishes to devote to the lesson. If sufficient computers are available (at school or home) the teacher can have students or student teams perform the activities (analyze the seismograms and calculate a few or all of the magnitudes and answer selected questions) independently. Alternatively, one could use the workstation or centers approach by setting up one or two computers in the room with the required software and data and have students rotate through the centers and complete some of the magnitude calculations and answer selected questions. Using this approach, it is useful to have “lead student” with higher ability and interest in computers or the subject serve as a trainer or technical resource for the student teams visiting the center. Finally, the teacher can lead the entire class or groups of students through the lessons using the interactive demonstration and exploration approach, first illustrating the software and the data and then performing the interpretation and magnitude calculation activities and answering selected questions with the participation of the students. This approach works best with your computer attached to an LCD projector but can also be effective with a group of students gathered around a single computer display. Comparing the results of student’s interpretations of the seismograms (amplitude, period, etc.) and calculated magnitudes with the correct answers, and correctly answering the questions chosen by the teacher provide an excellent assessment of student learning.
Before using this activity, students should have some understanding of earthquakes, plate tectonics and seismic wave propagation. Studies of Earth structure could be performed either before or after this activity. Appropriate information on these topics is contained in Bolt (1993, 1999). Activities related to these topics are available at www.eas.purdue.edu/~braile. The seismic wave activity using the slinky is particularly appropriate. The calculating magnitude activity is especially useful for classrooms running an AS-1 seismograph as the students can use their experience to interpret seismograms recorded by their AS-1 and routinely calculate earthquake magnitudes.
6. Connection to teaching standards: Connections of the calculating magnitudes activities and materials to the National Science Education Standards (1996) are shown in Table 1.
|
Table
1. “Calculating Magnitudes” and the National Science Education
Standards (NSES). |
|
NSES Standard
|
How standard is addressed by calculating magnitudes
activities and materials* |
Science Teaching Standards
|
Activities are
inquiry-based (A, B) and provide opportunities for assessment using questions
provided (C). |
Professional Development Standards
|
Activities provide
opportunities and resource material for teachers to learn about an Earth
science topic that is not likely to have been included in their previous
educational experiences (A, C) and include suggestions for effective teaching
strategies (B). |
|
Assessment Standards |
Authentic assessment
activities and questions for assessing achievement in learning key concepts
are included (C). |
Science Content Standards
|
|
|
-
Unifying
Concepts and Processes in Science |
Activities
provide experience with observation, evidence and explanation, and constancy,
change and measurement. |
|
- Science as Inquiry |
Activities
provide opportunities for practice of inquiry and of fundamental science
skills (Grades 5-8 and 9-12, A). |
|
-
Physical Science Standards |
Activities explore properties
and changes of properties in matter, motion and forces, transfer of energy
(Grades 5-8, B). Activities
explore structure and properties of matter, motions and forces, and
interactions of energy and matter (Grades 9-12, B). |
|
-
Earth and Space
Science -
Science in
Personal and Social Perspectives |
Activities
relate to energy in the Earth system (Grades 9-12, D). Activities explore
natural hazards (Grades 5-8, F; Grades 9-12, F). |
|
Science Education Program Standards |
Seismogram and magnitude
activities are developmentally appropriate, interesting and relevant, and
emphasize student understanding through inquiry, and are connected to other
school subjects (B). Seismogram and
magnitude activities provide practice with mathematics and analysis skills
(C). |
|
Science Education System Standards |
Because the software,
data and materials necessary to perform the seismogram and magnitude
activities are free and available on the Internet, they are easily accessible
to all students. |
*Letters
in parentheses identify specific standards within the six areas (Science
Teaching, Professional Development, Assessment, Science Content, Science
Education Programs, and Science Education System Standards) of the NSES.
7. References:
Bolt, B.A., Earthquakes and Geological Discovery, Scientific American Library,
W.H. Freeman,
Bolt, B.A., Earthquakes, (4th edition),
W.H. Freeman & Company,
National Research
Council, National Science Education Standards,
8. Earthquake recordings (24-hour screen
displays) and table of earthquake information:
Reference AS-1 on SpiNet http://www.earthscope-eon.org/spinet/
http://www.iris.edu/about/ENO/AS1AmaSeis.pdf
Reference accessing data http://web.ics.purdue.edu/~braile/edumod/eqdata/eqdata.htm
Reference as1 links and install page lwb http://web.ics.purdue.edu/~braile/ http://web.ics.purdue.edu/~braile/edumod/as1mag/as1mag.htm
http://web.ics.purdue.edu/~braile/indexlinks/as1.htm
Also technical assistance and a tutorial under the Help menu in AmaSeis
Slinky
http://web.ics.purdue.edu/~braile/edumod/slinky/slinky.htm
http://web.ics.purdue.edu/~braile/edumod/slinky/slinky.doc
http://web.ics.purdue.edu/~braile/edumod/slinky/slinky4.htm
http://web.ics.purdue.edu/~braile/edumod/slinky/slinky4.doc
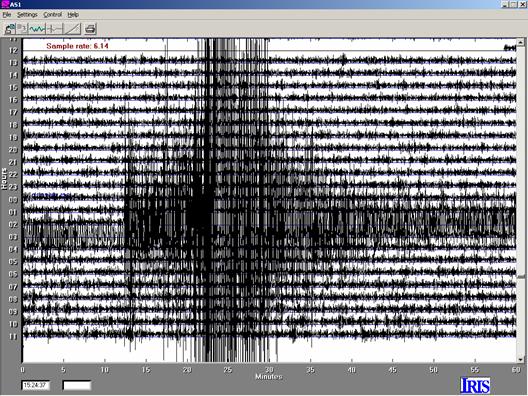
Figure 2. 24-hour AmaSeis
record for seismogram 3.1, M7.8 Colima,
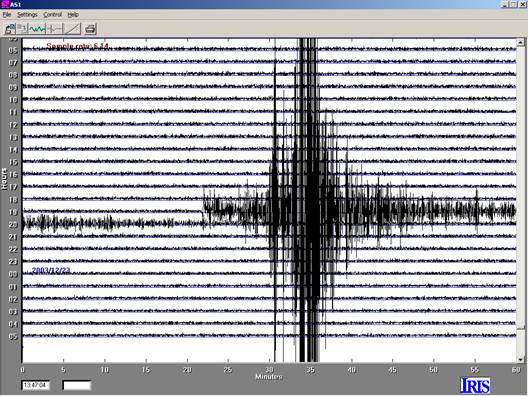
Figure 3. 24-hour AmaSeis
record for seismogram 3.2, M6.5
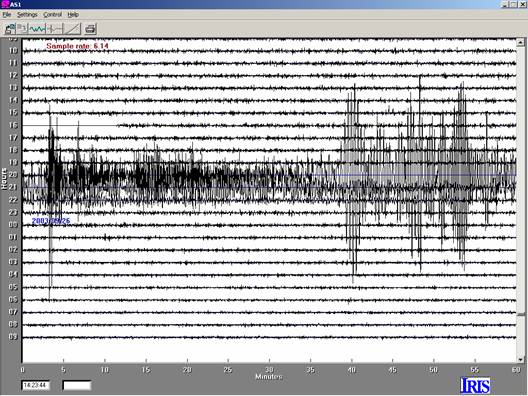
Figure 4. 24-hour AmaSeis
record for seismogram 3.3, M8.1
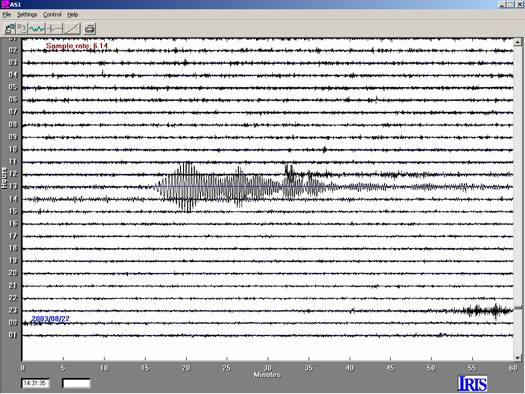
Figure 5. 24-hour AmaSeis
record for seismogram 3.4, M7.2
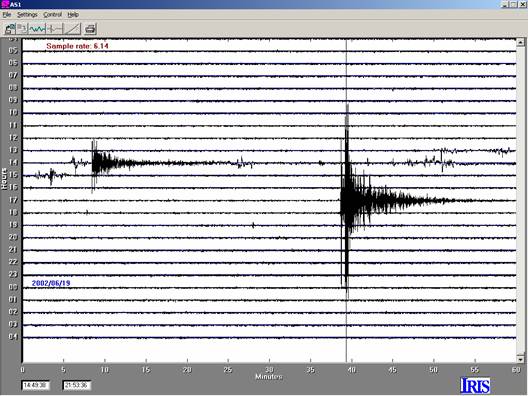
Figure 6. 24-hour AmaSeis
record for seismogram 3.5, M4.4
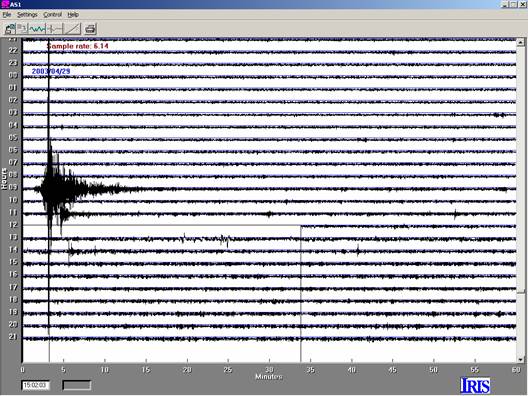
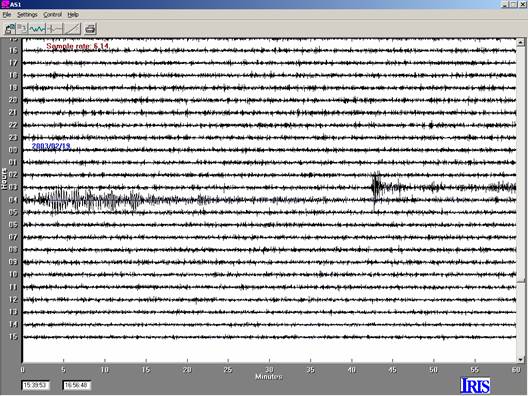
Figure 7. 24-hour AmaSeis
record for seismogram 3.6, M4.6
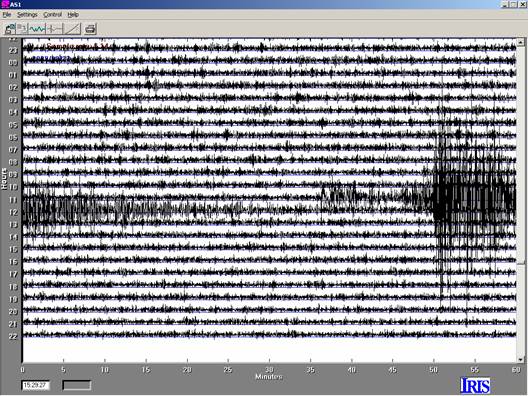
Figure 8. 24-hour AmaSeis
record for seismogram 3.7, M6.7
Figure
9. 24-hour AmaSeis
record for seismogram 3.8, M6.6
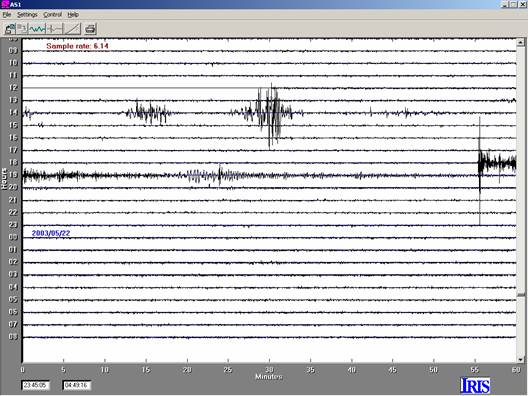
Figure 10. 24-hour AmaSeis
record for seismogram 3.9, M6.8
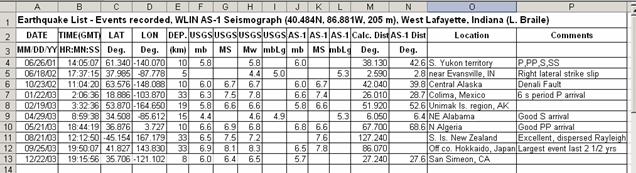
Figure 11. Table of
information for the earthquakes and seismograms used in this teaching module.
AS-1 Seismograph Links: www.eas.purdue.edu/~braile/ (click on “AS-1 Seismograph Information”)
List of AS-1 Teaching Modules: www.eas.purdue.edu/~braile/edumod/as1lessons/as1lessons.htm
[1]  Last
modified
Last
modified
The web page for this document is: http://web.ics.purdue.edu/~braile/edumod/as1lessons/magnitude/CalcMagnElect.htm.
Funding for this development provided by IRIS and the National Science Foundation.
ã Copyright 2004. L. Braile. Permission granted for reproduction for non-commercial uses.