Area Earthquakes 1
Larry Braile
http://web.ics.purdue.edu/~braile Sheryl Braile Happy October, 2006 |
|

Introduction:
This activity is designed to provide a better understanding of
earthquake activity, the locations of faults, and earthquake hazards in the
* MS Word and PDF versions of this document are located at:
http://web.ics.purdue.edu/~braile/edumod/bayarea/bayareaNew.doc, and
http://web.ics.purdue.edu/~braile/edumod/bayarea/bayareaNew.pdf.
A previous version of this activity using a 1990 USGS color poster (false-color satellite image and epicenters, http://wrgis.wr.usgs.gov/docs/gump/zulanger/bayarea/landsat.html) is available at: http://web.ics.purdue.edu/~braile/edumod/bayarea/bayarea.htm. A PowerPoint presentation (including images of the map, photos and images of the San Andreas fault zone, and information on the 1906 San Francisco and 1989 Loma Prieta earthquakes) related to the new (2004 map) activity can be found at: http://web.ics.purdue.edu/~braile/edumod/bayarea/BayAreaEQs.ppt.
Several attractive and useful
digital satellite images of the
Additional information on
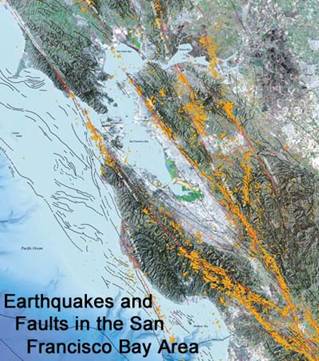
Satellite Image and Earthquake Map: The Earthquakes and Faults in the
Other Maps: A geologic map of the
Additional information and
teacher resources on the
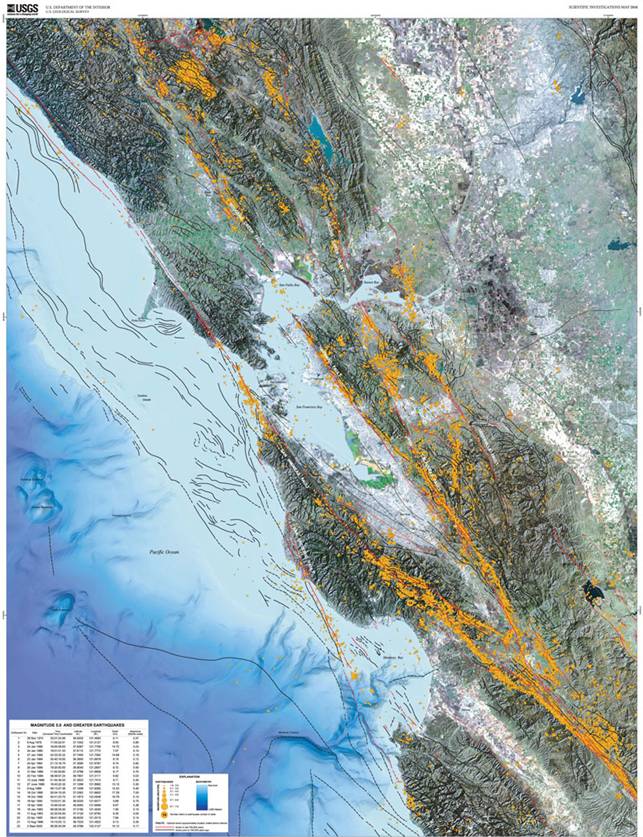
Figure 1. Earthquakes
and Faults in the
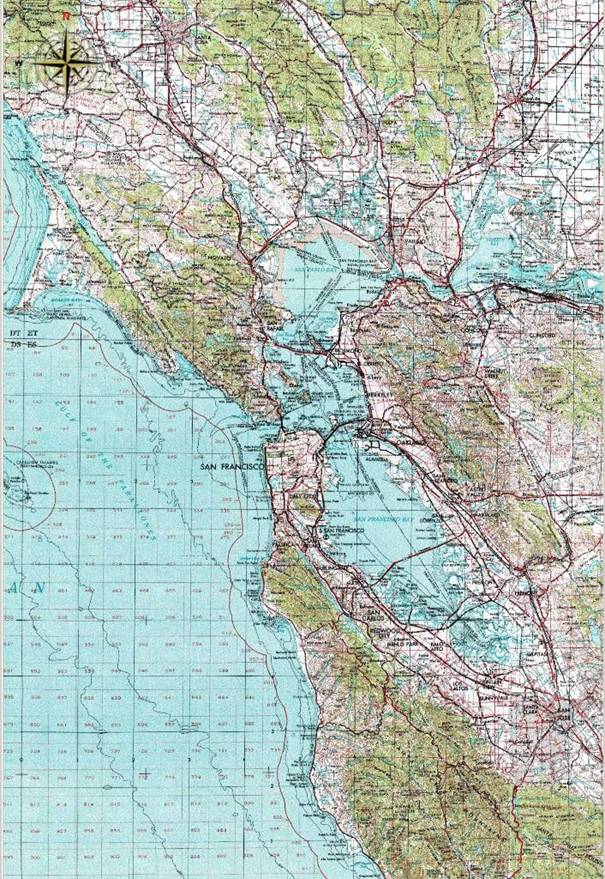

Figure 2. Topographic
map of a portion of the area shown by the earthquake and fault map in Figure 1.

Figure 3. Perspective view digital satellite image of
the San Francisco area with young faults (active in the past 700, 000 years)
plotted in red. This image and
additional satellite images for the
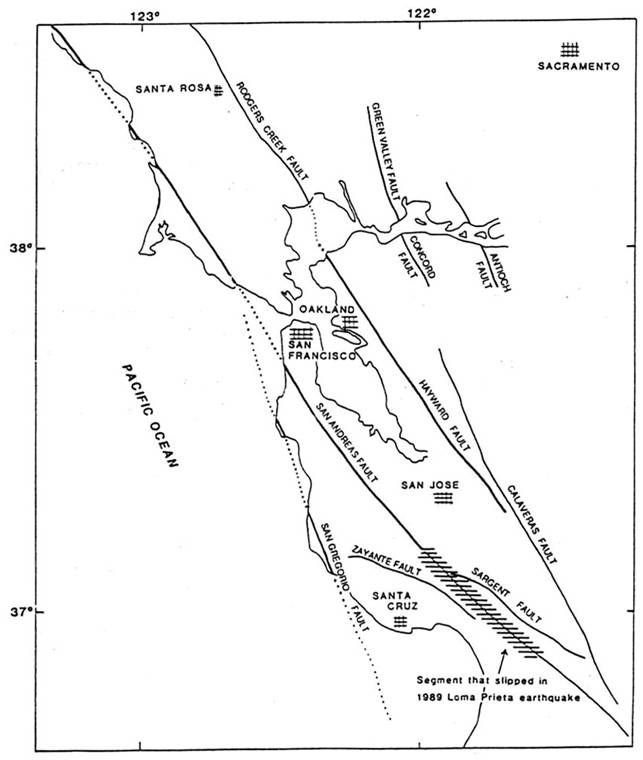
Figure 4. Major faults in the
Figure 5. Geologic map of the
Figure 6. Quaternary-active fault map of the
Hands-On Activity for the Classroom: (An efficient and effective strategy for
using this activity in the classroom is to obtain about 6 copies of the
earthquake map, laminate the maps for durability and marking with water soluble
felt pens, and place on tables in the classroom. Divide the students into groups and have them
examine and answer the questions and perform the tasks listed below. Each group should submit a written copy of
their answers and be asked to respond orally to one or more of the questions
during class discussion following the hands-on activity. A useful follow-up discussion or presentation
can focus on earthquake hazards and damage.
The PowerPoint presentation related to the
- Examine the Earthquakes
and Faults in the
- Using the maps in Figure 2 and 4 or a road map or an
atlas, find the following geographic localities on the earthquake
map:
- Find the following faults on the earthquake map:
- Examine the
earthquake epicenters (yellow dots, size of the dot is proportional to the
magnitude of the earthquake) and trends or clusters of epicenters visible
on the map. Note that there are
several young (faults <700,000 years are plotted in red) fault segments
with very few earthquakes. What are
the possible explanations for this observation?
- Find the epicenters
for the 22 M5+ earthquakes that are listed in the Table of Earthquakes on
the map. Summarize the general
locations of these larger events (Are they located along a small number of
faults? Are they located in one
particular area of the map?)
- Find the
epicenters for the 22 M5+ earthquakes that are listed in the Table of
Earthquakes on the map. Summarize
the general locations of these larger events (Are they located along a
small number of faults? Are they
located in one particular area of the map?)
- What
topographic or landscape features appear to be correlated with the young
faults on the map? Note that there
are significant young faults on both sides of the
- Note that the
San Andreas Fault north of about
- What other
significant faults (length greater than about 20 km, capable of generating
M6.5+ earthquakes) are close to population centers?
- Scientists know that buildings and other man-made
structures built on fill areas or areas of un-compacted sediments are more
likely to be damaged in an earthquake because these materials can
intensify shaking. Can you identify
areas on the map where relatively thick accumulations of these sediments
might be?
- Where is the plate boundary (on this map) between the
Pacific and North American tectonic plates? (Plate tectonic concepts can be
demonstrated using the hands-on activities, plate puzzle, http://web.ics.purdue.edu/~braile/edumod/platepuzz/platepuzz.htm,
and, teaching about plate tectonics and faulting using foam models, http://web.ics.purdue.edu/~braile/edumod/foammod/foammod.htm.)
- If the Pacific plate moves up the peninsula at an
average rate of 4 cm per year toward the northwest, how long will it take
for Santa Cruz (at the northern edge of Monterey Bay) to be due west of
San Francisco?
Discussion of Earthquake Hazards and Forecasting in
the
Many people look at this map and
the trace of the San Andreas Fault just south of
Scientists know that the Pacific Plate is sliding to the northwest relative to the North American Plate at an average rate of about 4 centimeters per year. The faults in this area are the surface expression of the edges of these two tectonic plates grinding past each other. In fact, the movement along these faults is neither smooth nor constant. The motion of the plates builds up strain (stored elastic energy caused by deformation of the lithosphere due to plate motions) along these faults until the stress becomes too much and the built up pressure is released through an earthquake.
By studying these, and other
faults scientists recognize the patterns of earthquakes that relieve the stress
in this constantly moving system. The
history of earthquakes in the
Scientists continue to study earthquake patterns. As our understanding of earthquake systems increases, so does our ability to predict the impact on the human environment.
In the early to mid 1980s,
scientists began forecasting the Loma Prieta earthquake. Scientists had judged the
In July of 1990, after the Loma
Prieta Earthquake, the National Earthquake Prediction Evaluation Council convened
a panel of experts to re-evaluate predictions for the
The article goes on to say, "More importantly, when the probabilities of earthquakes on all of these segments are combined mathematically, there is a 67 percent chance for at least one earthquake of magnitude 7 or larger in the San Francisco Bay Area between 1990 and 2020. Such an earthquake could strike at any time."
While we cannot predict the exact date and time of an earthquake, nor can we control them, we know enough to mitigate much of the damage that can be caused by an earthquake. Our schools play a critical role in educating people about the potential hazards to human life and property and about appropriate safety precautions in earthquake territory. With this information, our students begin to learn about designing and developing buildings and communities in balance with their natural environment.
References:
Graymer, R.W, B.C. Moring, G.J. Saucedo, C.M. Wentworth, E.E. Brabb, and K.L. Knudsen, Geologic Map of the San Francisco Bay Region, U.S. Geological Survey, Scientific Investigations Map 2918, 2006 (also available online and for download at: http://geomaps.wr.usgs.gov/sfgeo/index.html).
Graymer, R.W, William Bryant, C.A. McCabe, Suzanne Hecker, and C.S. Prentice, Map of Quaternary-active Faults in the San Francisco Bay Region, U.S. Geological Survey, Scientific Investigations Map 2919, 2006 (also available online and for download at: http://geomaps.wr.usgs.gov/sfgeo/index.html).
Major Quake Likely to Strike Between 2000 and 2030, U.S. Geological Survey Fact Sheet 152-99, http://pubs.usgs.gov/fs/1999/fs152-99/
Progress Toward a Safer Future Since the 1989 Loma Prieta Earthquake, U.S. Geological Survey Fact Sheet 151-99, http://pubs.usgs.gov/fs/1999/fs151-99/.
Putting Down Roots in Earthquake Country (
Sleeter, B.M., J.P. Calzia, S.R. Walter, F.L. Wong, and G.J. Saucedo, Earthquakes and Faults in the
Zoback, M.L., The 1906 earthquake and a century of progress in understanding earthquakes and their hazards, GSA Today, volume 16, April/May, p. 4-11, 2006. (Also available online at: ftp://rock.geosociety.org/pub/GSAToday/gt0604-05.pdf.)
Earthquake file for the
[1]  Last
modified November 19, 2006
Last
modified November 19, 2006
The web page for
this document is:
http://web.ics.purdue.edu/~braile/edumod/bayarea/bayareaNew.htm
Partial funding for this development provided by the National Science Foundation.
ã Copyright 2000-06. L. Braile. Permission granted for reproduction for non-commercial uses.