Earth’s Interior StructureÓLarry Braile Professor,
August, 2000 http://web.ics.purdue.edu/~braile |
|

Educational Objective: Develop understanding of the structure of the Earth’s interior (and ultimately, relationships to plate tectonics, occurrence of earthquakes and volcanoes, and the origin of the Earth’s magnetic field, etc.) by constructing a scale model of a “slice” of the interior of the Earth and studying the material properties of Earth’s interior. The activity also provides useful practice with the concept of scale.
Possible Preparatory
Lessons/Activities:
Density
Elasticity and seismic waves
Seismic waves and travel times in the Earth
(evidence from seismic velocities for the existence of the core)
Plate tectonics -- Lithosphere, asthenosphere
Primary chemical layering of the Earth -- Crust, Mantle, Core
Materials:
two 11” x 17” sheets of paper taped together along the short side*
meter stick
pencil
~ 70 cm long string with loop at one end
transparent tape
colored pencils, crayons or felt pens (optional)
Procedure: Draw a light center line and “width lines” (short dashed lines on “construction detail”, Figure 1) on the 34” x 11” paper (two 11” x 17” sheets of paper taped together) and construct a scale model of a slice (like a “pizza slice”) of the Earth’s interior. The scale is 1:10 million or 1 cm = 100 km (1 cm on the model represents 100 km in the actual Earth), resulting in a slice with a radius of 63.7 cm corresponding to the real Earth’s radius of 6371 km (10 million times the size of the scale model). Using the dimensions shown on the “construction detail” drawing (Figure 1) will provide a 15° segment of the Earth’s interior.
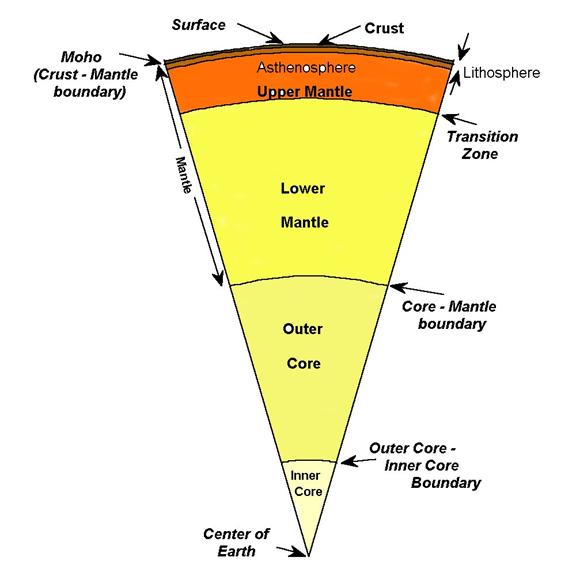
Once the surface arc line (draw using the string with a loop and a pencil with the length from the center point to the pencil in the loop being 63.7 cm) and the straight (angle) lines have been drawn, the light pencil lines can be erased. Complete the scale model slice of the Earth by drawing arcs at the appropriate radii corresponding to the Moho, Lithosphere-Asthenosphere, Transition Zone, Core-Mantle, and Outer Core-Inner Core boundaries as given in Table 1 and illustrated on the Earth’s Interior Structure diagram (Figure 2).
For the first two boundaries below the surface (Moho and Lithosphere-Asthenosphere), it is easier to measure downward (0.35 cm and 1.0 cm) from the surface to adjust the length of the string. Note that converting the depth and radius measurements, in kilometers on the Table, to the 1:10 million scale, one can simply move the decimal two places to the left and the number will be in cm. For example, 6371 km is 63.71 cm at the 1:10 million scale (see Table 1). More complete information on the layers of the Earth's interior is given in Table 2.
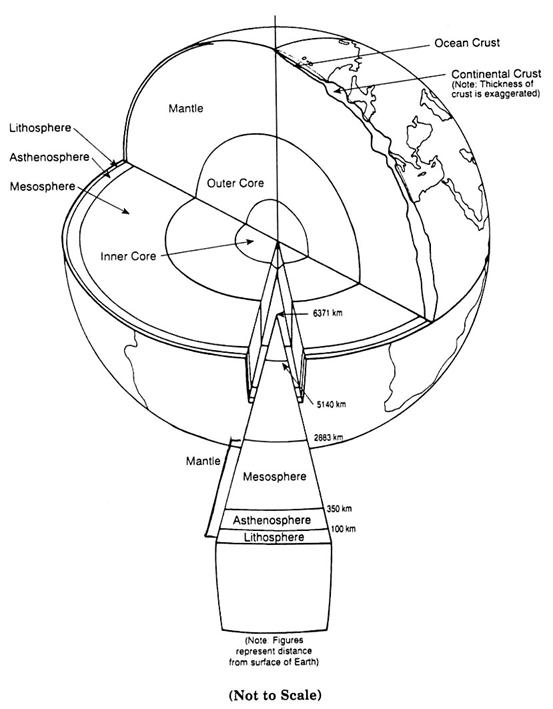
Label the boundaries and layers of the Earth and (optionally) color the various layers representing spherical shells. Suggested coloring of slices to enhance visibility and imply relative temperature in the Earth’s interior is: inner core - white, outer core - yellow, mantle (below the lithosphere) - orange, upper mantle - red, lithosphere - brown. (See Figure on page 57 in Seismic Sleuths to illustrate the relationship of the “slice” to the spherical Earth. A slightly modified diagram from page 57 of Seismic Sleuths is shown in Figure 3. Also, see Figure on page 127 of Bolt, 1993). Examples of slices constructed by students are shown in Figures 4 and 5.
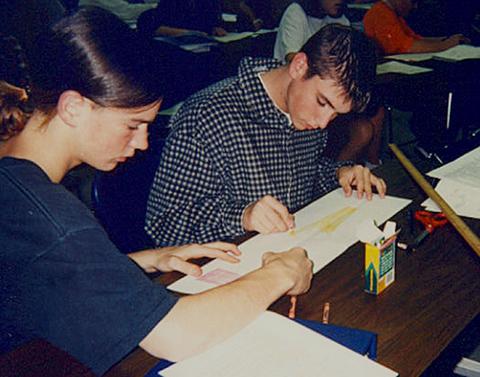
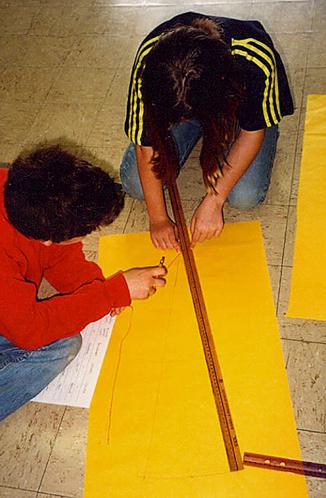
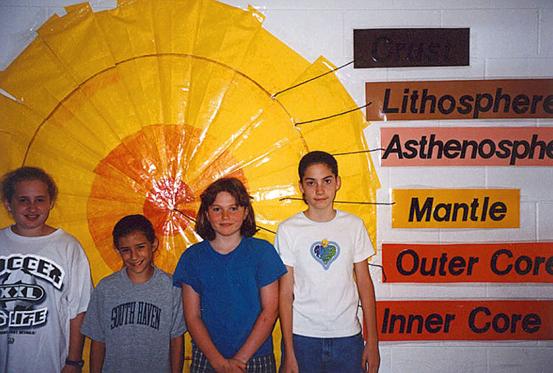
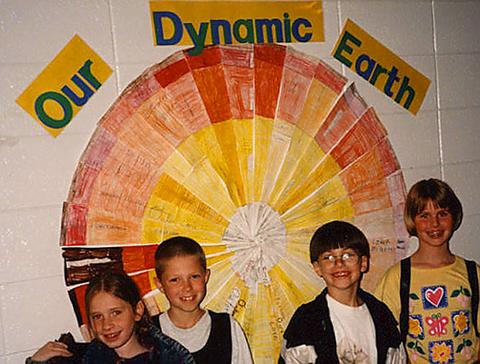
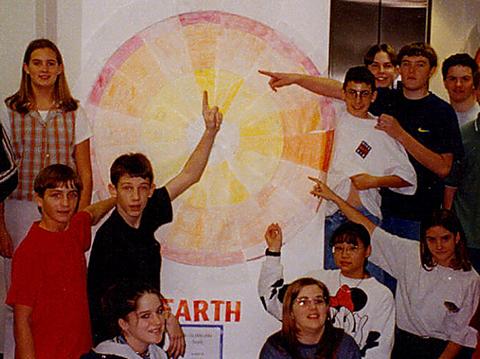
A suggested extension of this activity for a classroom is to cut out each of the scale model slices and mount them on the floor or wall. Twenty-four of the slices (using the 15° slice produced by the measurements shown on the attached “construction detail” drawing, Figure 1) can be arranged into a complete circle representing a 1:10 million scale cross section through the entire Earth. Label the main regions: lithosphere, mantle, outer core, inner core. This extension strengthens the scale model concept, aids in visualizing the depths and relative sizes of the various regions of the Earth’s interior, and increases involvement of the students because each student contributes a “slice” to the full model. An example of a “classroom set” of slices of the Earth’s interior is shown in the attached photographs (Figures 6, 7 and 8). In this scale model constructed from each student’s slice, the radius of the resulting circle is 63.7 cm and the various layers are labeled.
The dimensions shown on the “construction detail” drawing (Figure 1) can be modified to make slices of different angles so that a “complete Earth” can be made by a classroom of different numbers of students, one slice from each student. See Table 3 for measurements for the “width lines” corresponding to different angles of the “slice” and different number of slices (one from each student) that will be needed to make a complete Earth.
Extensions:
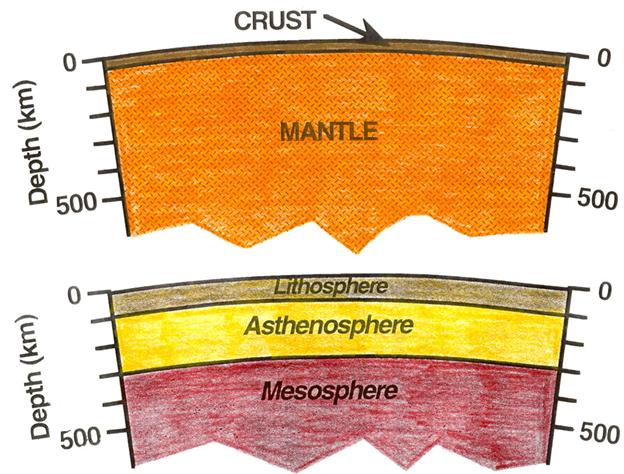
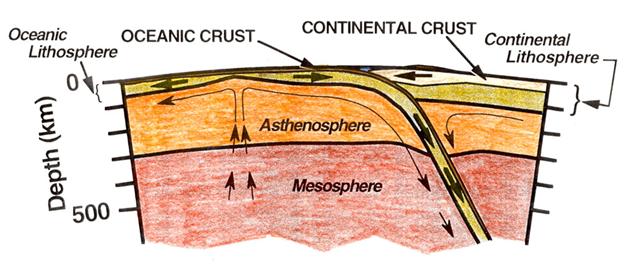
1. One of the confusing concepts of Earth structure is the distinction between chemical layering (crust, mantle and core) and mechanical layering (lithosphere, asthenosphere and mesosphere). The scale model illustrates all of these layers on a single diagram. The chemical and mechanical classifications for the upper layers of the Earth are illustrated in Figure 9. Tables 4 and 5 contain the layer depth information for the chemical and mechanical classification.
2. The
interior of the Earth is also not quite as simple as the spherical shell models
(the 1:10 million scale model and Figures 2 and 6) suggest. The real Earth structure has significant
lateral variability, particularly because of plate tectonic processes. A typical Earth structure showing oceanic and
continental regions, a mid-ocean ridge spreading center and a subduction zone
is illustrated in Figure 10. This
schematic model of the upper layers of the Earth is similar to structure
inferred for the western coast of
3. An interesting feature of the 1:10 million scale of our model is that the standard unit of length in the metric system was (historically) defined as one ten millionths of the distance along the surface of the Earth from the pole to the equator. Because the scale of our model is 1:10 million, the distance from the pole to the equator on our whole Earth model, made from a classroom set of slices as described above, will be 1 meter. Have the students draw the poles and equator on the model and check the measurement using a string positioned over the Earth’s surface.
4. A similar exercise constructing a scale model of the Sun (at a 1:1 billion scale; note difference in scale) can be utilized to reinforce the concept of scale and examine the internal structure of a star. Data for making the scale model are provided in Table 5. Additional information on the interior of the Sun can be found in Beatty and Chaikin (1990), Lang (1996) and Smoluchowski (1983). [A scale model activity for the solar system is described by Braile (1994)]. The students should recognize that the 1:1 billion scale model of the Sun is approximately the same size as the 1:10 million scale model of the Earth. Thus, because of the differences in scale, the Sun has a diameter that is about 100 times larger than the Earth’s diameter.
Related Materials:
1. Pizza the Earth activity, pp. 54-55 and Masters 12, 15, 17, and 18 of Earthquakes (Tremor Troops) - A Teacher’s Package for K-6, FEMA/NSTA, 169 pp., 1988 (note mistake in scale on page 55). The activity is on page 52-53 of the revised (August, 2000) edition of Tremor Troop (FEMA 159). Masters 12a, 12b, 15, and 16 are associated with the Pizza the Earth activity.
2. Diagram on p. 57, Seismic Sleuths, FEMA/AGU, 364 pp., 1995.
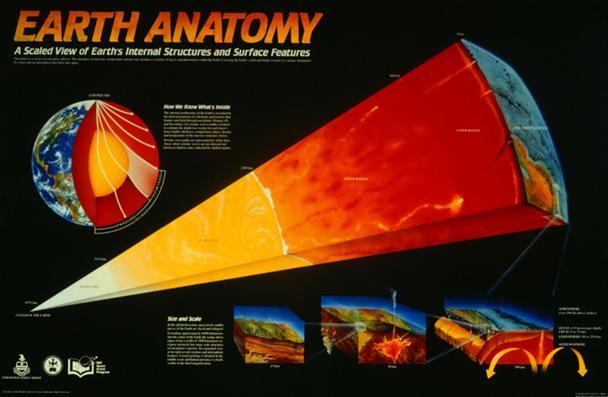
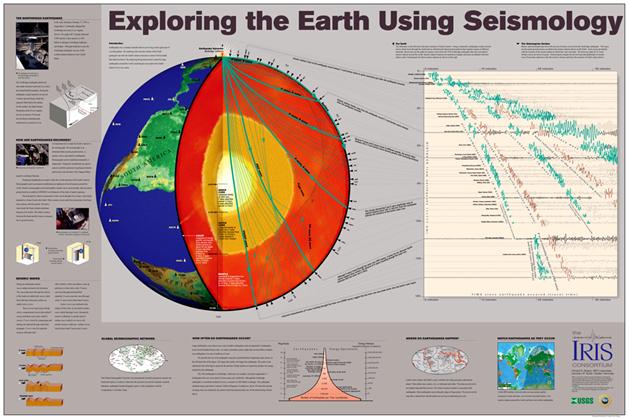
3. “Earth Anatomy” poster (Figure 11); an attractive colored poster illustrating the structure and relative scales of Earth’s interior, The Wright Center for Science Education, Tufts University (http://www.tufts.edu/as/wright_center/svl/posters/erth.html). The scale of the slice of the Earth in the poster is close to 1:10 million, but not exactly. As a challenge question, have students determine the scale of the poster by measuring the radius with the meter stick and using Earth’s actual radius of 6371 km. The IRIS poster, Exploring the Earth Using Seismology (Figure 12), is a good resource for learning about how seismic waves are used to determine Earth structure.
4. The “3-D Earth” activity (http://web.ics.purdue.edu/~braile/educindex/educindex.htm) reinforces the concepts of scale and structure of the interior of the Earth. It also provides a useful, and surprising, demonstration of the relative volumes of the Earth’s layers.
5. Chapter 6 on the Earth’s Interior in Bolt, B.A., Earthquakes and Geological Discovery, Freeman, New York, New York, 229 pp., 1993 (see Figure on p. 143 showing the velocity and density of rocks with depth through the Earth).
*I apologize for the use of non-metric units! However, the availability and low cost of 11” x 17” photocopy paper makes this paper convenient for this activity.
References:
Beatty, J.K., and A. Chaikin (Eds.), The New Solar System, 3rd edition, Sky Publishing Corporation and Cambridge University Press, Cambridge, 326 pp., 1990.
Bolt, B.A., Earthquakes and Geological Discovery,
Scientific American Library, W.H. Freeman & Company,
Braile, S.J., A journey through the Solar System, Project SPICA: A Teacher Resource to Enhance Astronomy Education, p. 53-57, Kendall/Hunt Publishing Co., Dubuque, 1994.
FEMA/AGU, Seismic Sleuths – Earthquakes – A Teachers Package on Earthquakes for Grades 7-12, American Geophysical Union, Washington, DC, 367 pp., 1994.
Lang, K.R., Unsolved mysteries of the Sun – Part 1, Sky & Telescope, p. 38-42, August, 1996.
Lang, K.R., Unsolved mysteries of the Sun – Part 2, Sky & Telescope, p. 24-28, September, 1996.
National Science Teachers Association,
Earthquakes: Tremor Troop – A
Teacher’s Package for K-6 grades, NSTA Publications,
Smoluchowski, R., The Solar System, Scientific American Library, W.H. Freeman & Company, New York., 174 pp., 1983.
U.S. Geological Survey, This Dynamic Earth – The Story of Plate Tectonics, USGS Map Distribution Center, PO Box 25286, Denver, CO, 80225, 1-888-ASK-USGS, http://pubs.usgs.gov/publications/text/dynamic.html.
Table 1. Measurements for Earth’s Interior Structure
(“Pie-Slice”) Activity.
|
|
Actual |
Scale Value |
|
Radius of Earth |
6371 km |
63.7 cm |
|
Depth* to base of the crust (average) |
35 km |
0.35 cm |
|
Depth* to base of lithosphere (average) |
100 km |
1.0 cm |
|
Depth* to base of upper mantle |
670 km |
6.7 cm |
|
Depth* to core-mantle boundary |
2885 km |
28.9 cm |
|
Depth* to outer core-inner core boundary |
5155 km |
51.6 cm |
*Measure downwards from the surface after drawing the arc representing the surface at a distance of 63.7 cm from the Earth’s center and drawing the diagonal lines completing the “pie-shaped slice” of the Earth.