

Accessing current, recent and historical
earthquake data 1
(L. Braile, October 2003, revised May,
2004, November, 2004)
http://web.ics.purdue.edu/~braile
Introduction: Many Internet tools are currently available for accessing earthquake data. Using these tools one can obtain information (such as location, origin time and magnitude) about the most recent earthquakes; search historical earthquake catalogs for earthquakes in a given region over a selected time period; and view, download or make maps of recent or historical earthquake activity of the world or of a selected region. The tools support education and research activities related to earthquakes such as: maintaining a classroom map of significant (magnitude greater than or equal to 5) earthquakes; calculating earthquake magnitude from educational seismograph records and comparing with official magnitude estimates; obtaining historical earthquake data for a specific area to relate a recent event to the background seismicity; analyzing sequences of earthquake activity, performing statistical analysis of earthquakes (such as the frequency of occurrence of earthquakes of various magnitudes), and obtaining earthquake data for studies of aftershock sequences or other event time series of interest. Below are some sites, instructions and examples of accessing earthquake data from the Internet. The sites can be used to obtain recent and historical earthquake data. This document is primarily an educational resource for efficiently and effectively using Internet resources related to earthquake event (hypocenter, origin time and magnitude) information. Information on obtaining and using seismograms can be found at Using AmaSeis.
In addition to the web version of this document, MS Word and PDF versions are available at:
http://web.ics.purdue.edu/~braile/edumod/eqdata/eqdata.doc
http://web.ics.purdue.edu/~braile/edumod/eqdata/eqdata.pdf.
List of Contents (click on topic to go directly to that section, use the red up arrows to return to the List of Contents):
1.1 Option to obtain seismograms for certain events (WILBER II)
2. IRIS Event Search (online earthquake data and mapping tool)
2.1 Pre-assembled maps and lists
2.2 Event search (with example)
2.3 Creating a map with stations and S minus P location circles
3. USGS Current Earthquakes (earthquakes.usgs.gov, lists, maps, additional information)
3.2 Detailed information including magnitudes
4. USGS Earthquake Catalog Search
4.1 Catalog search, Global (Worldwide) example
4.2 Catalog search, Rectangular Area example
1. IRIS (Incorporated Research Institutions for Seismology) Seismic Monitor (www.iris.edu, click on “Seismic Monitor”, map is updated every 30 minutes; open “About…” for information on Seismic Monitor): The Seismic Monitor is an attractive display of recent earthquake activity around the world Figure 1). Additional information related to earthquakes, seismograph stations and recent activity is also provided. By clicking on the map in any location, a close-up view of that region is produced.
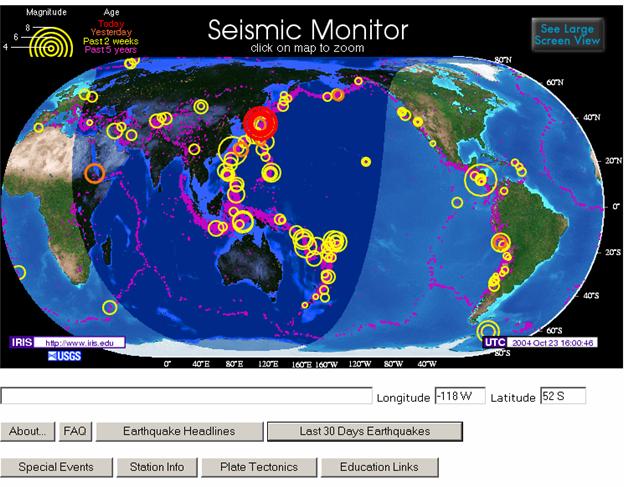
Figure 1. IRIS Seismic Monitor
(viewed at about
To obtain seismograph station information, click on the “Station Info” button. Selecting “Last 30 Days of Earthquakes” produces a list (Figure 2). Clicking on the map generates a close-up view of a region (Figure 3), in this case the northern Pacific region. Clicking on the close-up map view (Figure 3) produces a list (figure 4) of up to 30 events within 10 degrees of the location that was selected.
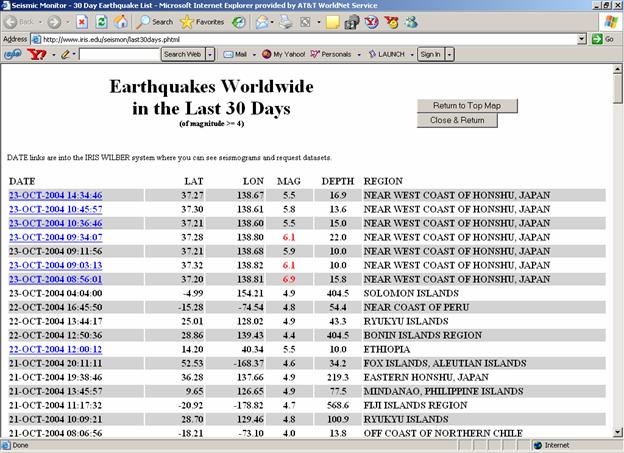
Figure 2. List of last 30 days
of earthquakes generated at about
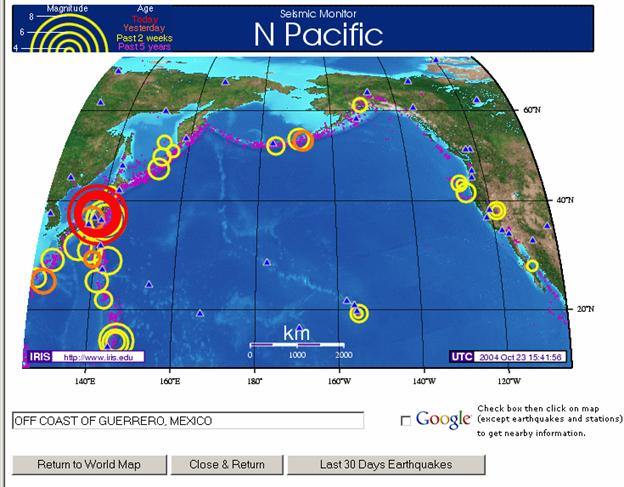
Figure 3. Close up view of the
north Pacific area created at about
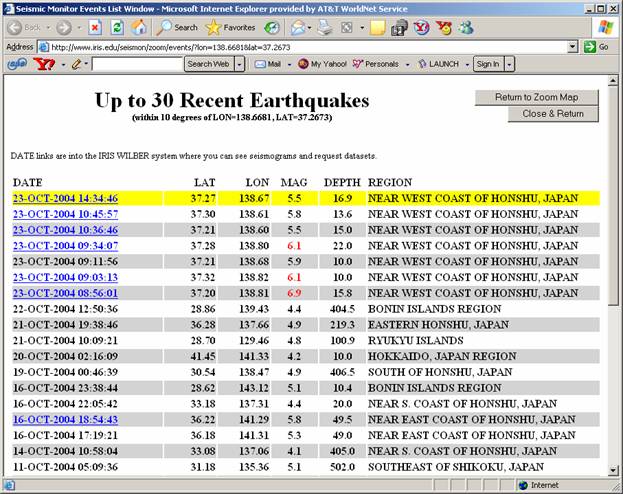
Figure 4. List of recent events
within 10 degrees of the selected location.
(The magnitude of the Honshu,
![]()
Return to list of contents
1.1 Option to obtain seismograms for certain
events: Earthquakes of sufficient
size or of particular interest are selected for automatic generation of
seismograms that can be accessed by the IRIS DMC (
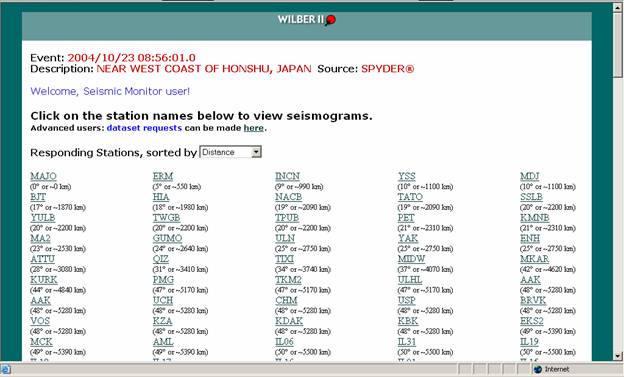
Figure 5. Portion of WILBER II
screen for the
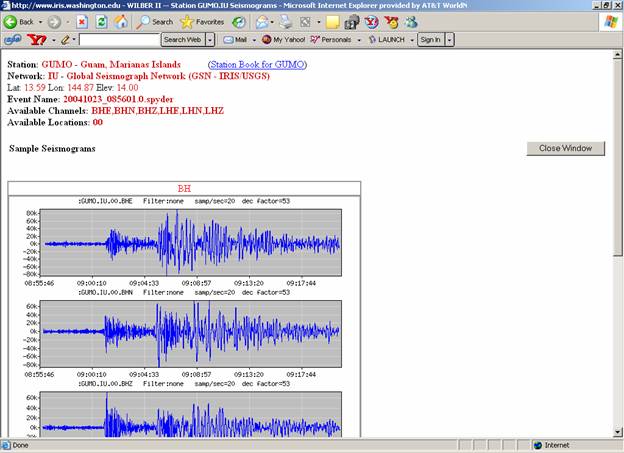
Figure 6. Seismogram display for
station GUMO for the
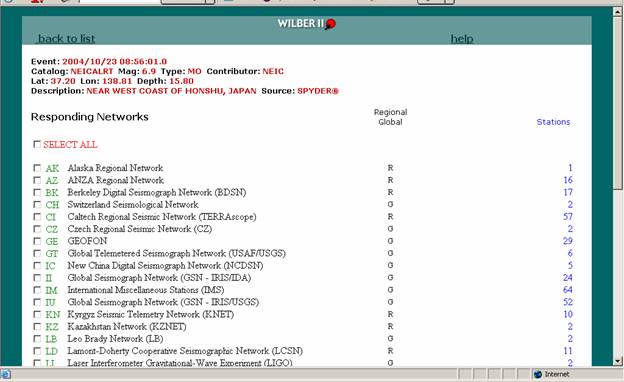
Figure 7. WILBER II page to
access the
![]()
2. IRIS Event Search (for historical data), from www.iris.edu, select “Data”, then “Types of Data”, then “Search the catalogs”, then “Event Search”). In the Event Search, you can view pre-assembled maps or search the historic earthquake catalog and display a list of earthquakes (you can print or copy and paste to a document) and create a map of epicenters: The IRIS event search tool allows one to search the historical earthquake catalog (by area, time period, magnitude range and depth of focus of earthquakes) to create a list of earthquakes that correspond to the search parameters, create maps of epicenters from the search, and optionally, show user-defined earthquake location information.
2.1 Pre-assembled maps and lists: Near the top of the Event Search page, selecting the link to pre-assembled event maps and lists allows one to access pre-assembled maps and lists for recent earthquake activity. An example is shown in Figure 8. The pre-assembled data link is located near the top of the Event Search page which is illustrated in Figure 9.
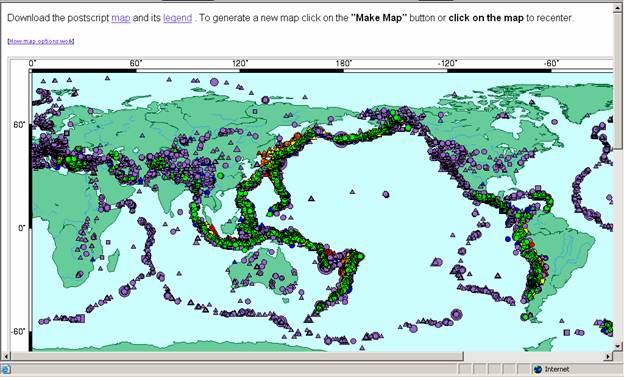
Figure 8. Example of a
pre-assembled map, in this case showing earthquakes in the last 365 days
(accessed
![]()
2.2 Event Search: The Event Search page (Figure 9; accessed from www.iris.edu, select “Data”, then “Types of Data”, then “Search the catalogs”, then “Event Search”) allows one to search the earthquake catalog for events. For example, the entries shown in Figure 9, search the catalog for events of M6+ that occurred from January 1, 1990 to December 31, 1999 within an area that includes northern South America, Central America and part of North America (latitude -15 to 55, longitude -165 to -65). After entering the search parameters, click on Submit Search. The results of the search are a list of earthquakes (in this case, part of the list shown in Figure 10). Clicking on Make Event Map at the top of the list (Figure 10) results in a map of epicenters as shown (for this event search example) in Figure 11.
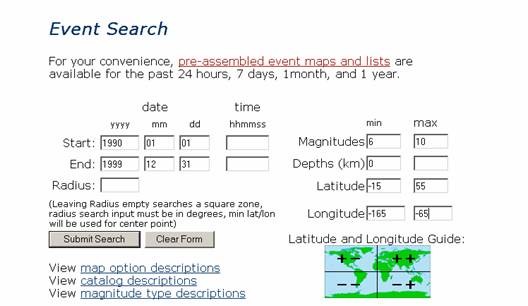
Figure 9. Example of dialog
boxes for the Event Search
tool. The data entered here were
designed to search for earthquakes of
magnitude 6 and above for an area that includes northern South America, Central
America and part of

Figure 10. List produced by the Event Search illustrated in Figure
9. Select Make Event Map to generate a map of the selected area and the
events on the Event Search list
shown here.
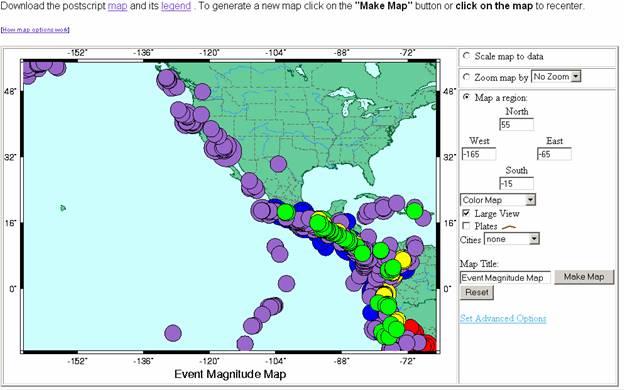
Figure 11. Map generated by the Event Search illustrated in Figures 9
and 10. The options to the right of the
map allow the user to enter a title, change the map region (to further zoom in,
for example), or add plate boundaries.
Scrolling down on this screen allows one to access additional options as
shown in Figure 12.
Because the dot size in the resulting map (Figure 11) is fairly large, we use one of the event search mapping options to change the maximum dot size. If we scroll down the page, additional options are available (Figure 12). Changing the maximum dot size to 0.25 as illustrated in Figure 12 and selecting Make Map (to re-plot), results in the map shown in Figure 13. The options shown to the right of the map allow one to select an different area to plot (for example, to zoom in; by changing the latitude and longitude limits, add pate boundaries, change the map to black and white, add city locations, or add a title. Clicking on Make Map (to the right of the map) will re-plot the map with the new options. The link to Set Advanced Options allow further mapping options.
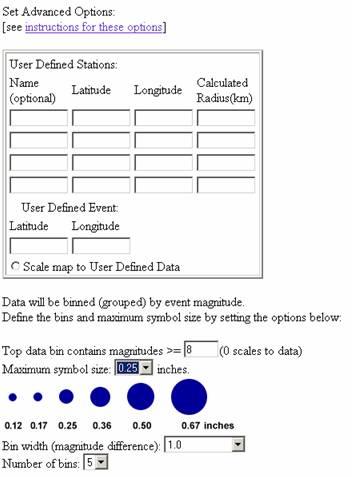
Figure 12. Additional options
near the bottom of the page illustrated in Figure 11. A link to the instructions for the User Defined Stations options is
located near the top of this section.
The Maximum dot size for the earthquakes can also be changed (as is done
here, selecting the value 0.25 to produce the plot shown in Figure 13 after
clicking on Make Map).
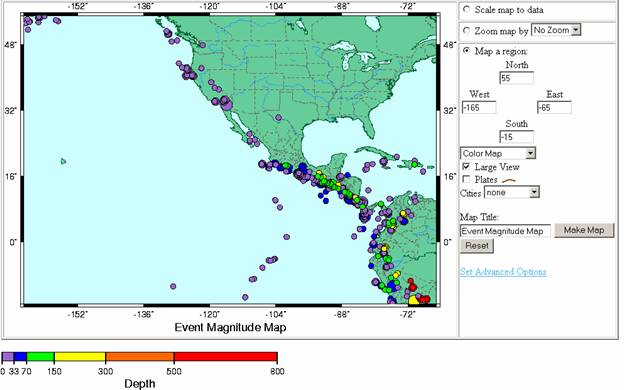
Figure 13. Event map produced
after changing the maximum dot size for epicenters to 0.25 as shown in Figure
12.
![]()
2.3 Creating a map with stations and S minus P location circles: The Event Search mapping tool can also be used to generate an attractive map for use with the S minus P earthquake location method. If S minus P times and inferred epicenter-to-station distances are known for 3 or 4 seismograph stations, these data can be entered into the optional user-defined data area (shown near the top of the screen image in Figure 12). The method works best if distinct P and S arrivals are visible on the seismograms and if the seismograph stations are located such that the earthquake is “within” the area covered by the 3- or 4-station “network”. Because S arrivals are weak for epicentral distances of greater than about 105 degrees and are virtually absent for distances of 120 degrees or more, an S minus P location should use stations that are located within about 100 degrees of the epicenter. Station coordinates can be found online (see section 3.13 of Using AmaSeis). Additional instructions for using the Event Search tool to plot stations, an event epicenter and S minus P circles are linked to the Event Search pages or available directly at:
http://www.iris.edu/quakes/eventSearchInstructions.htm. The S minus P times can be interpreted from the seismograms with the AmaSeis software or simply by measuring the arrival times on seismograms and using the S minus P tables or travel time curves available at the USGS distance calculator site (http://neic.usgs.gov/neis/travel_times/). Additional information about using AmaSeis to view and interpret seismograms and several pre-assembled S minus P location data sets are available at the Using AmaSeis web page (see sections 3.6 and 6, respectively). Another effective and interactive site for learning about earthquake location is the Virtual Earthquake Courseware
(http://www.sciencecourseware.com/eec/Earthquake/).
An example of
making a map with the Event Search tool (after performing a search for
historical earthquakes in a region as shown in section 2.2 above) and displaying the S
minus P results is provided in Figures 14-16.
Figure 14 shows the user-defined data for an S minus P location for the
http://web.ics.purdue.edu/~braile/edumod/as1mag/as1mag2.htm.
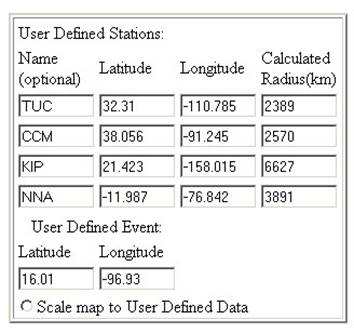
Figure 14. Optional user-defined
data for the
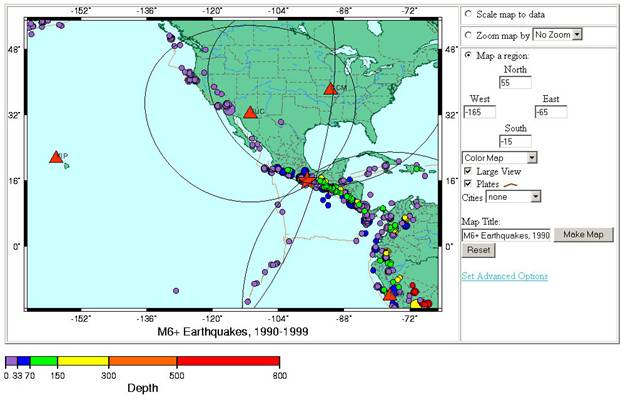
Figure 15. After the optional
user-supplied data shown in Figure 14 were added, the Make Map control (to the right of the event map) to produce this
map. The Plates option was also checked to plot plate boundaries and a title
was added in the Map Title box.
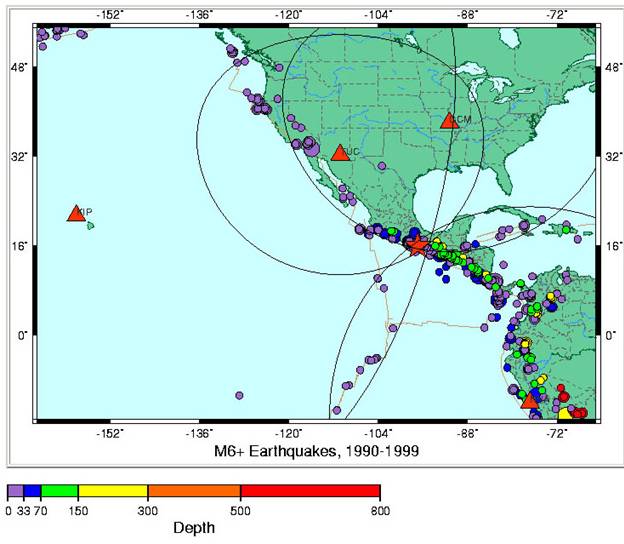
Figure 16. Final event map
(enlarged from Figure 15) showing historical earthquakes of magnitude M6+ for
the selected area, and the S minus P location data (circles) that approximately
intersect near the correct epicenter (red star). The S minus P circles do not look like
perfect circles because of the map projection.
Station locations are shown by the red triangles.
![]()
3. USGS (U. S. Geological Survey) Earthquake Website (earthquake.usgs.gov, click on “Latest Quakes”, then “NEIC Current Earthquake Information” for list of recent events; can also access last 30 days activity, maps and other data lists): The USGS earthquake web site provides a wealth of information about recent earthquakes as well links to an online catalog search for historical earthquakes (see section 4 below) and other earthquake and earthquake education resources. Much of the information found at earthquake.usgs.gov is generated automatically when earthquakes occur so it is available very soon (sometimes within minutes) after an event. Because the most recent information is preliminary, changes to location, origin time and magnitude data (and additions to the ancillary information) are sometimes made in subsequent listings and final earthquake catalog entries.
3.1 Recent earthquake lists: To access lists of recent earthquake from the USGS earthquake home page (Figure 17) select Latest Quakes (upper left corner of the page) which results in the “Earthquake Activity” page illustrated in Figure 18. On the “Earthquake Activity” page, select NEIC Current Earthquake Information from the list on the left side of the page. A list of the most recent earthquakes (similar to that show in Figure 19) will appear. Selecting an earthquake from the list (select links from the “Date” or “Comments” columns) will display a page (similar to that shown in Figure 20 for the Honshu earthquake) that provides specific information about that earthquake (including maps of the epicentral area, historical earthquake activity maps) and links to related sites. Information on significant events can also be accessed directly from the USGS earthquake page (Figure 17) by selecting the event from the list under Earthquake News and Highlights. The list of recent earthquakes (Figure 19) includes events during the last 7 days. Scrolling down the page, one can find links to earthquake lists for the past 8-30 days and large or noteworthy earthquakes during the current year and an interactive earthquake map that allows the user to click on an epicenter to find out more information about that event.
The Earthquake Activity page (example shown in Figure 18) also contains links to Shake Maps that show maps of the intensity of shaking for selected events, and Seismogram Displays which accesses sites that can display recent seismograms from seismograph networks.
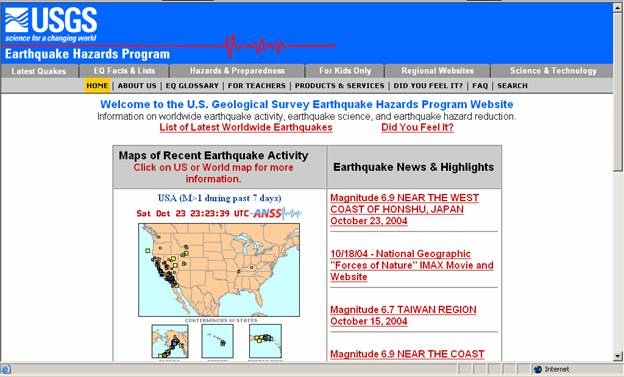
Figure 17. The USGS earthquakes
page (accessed
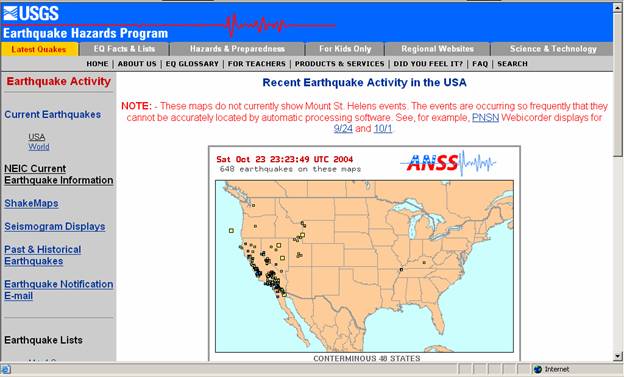
Figure 18. Recent earthquake
activity page (accessed
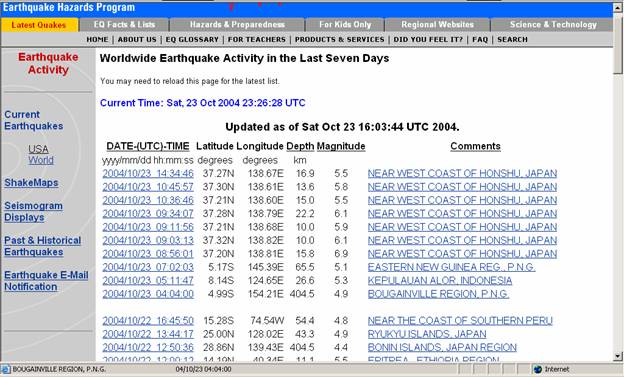
Figure 19. List of recent
worldwide earthquake activity (accessed
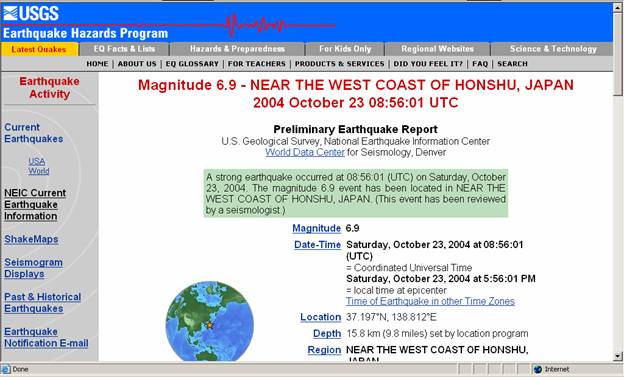
Figure 20. Selecting a link to a
significant earthquake from the right side of the USGS earthquakes page (Figure
17) will produce a screen similar to the one shown here (this page was for the
October 23, 2004 M6.9 Honshu, Japan earthquake). (The magnitude of the Honshu,
![]()
3.2 Detailed information including magnitudes: Detailed information about events can be
obtained by clicking on an event (from the recent earthquake lists, example
shown in Figure 19). For details of magnitude information including mb, MS and
mbLg magnitudes, select an event, select Phase
(Arrival Time) Data (scroll down the page to find the “Phase (Arrival Time)
Data” link). An example of the Phase
Data for the
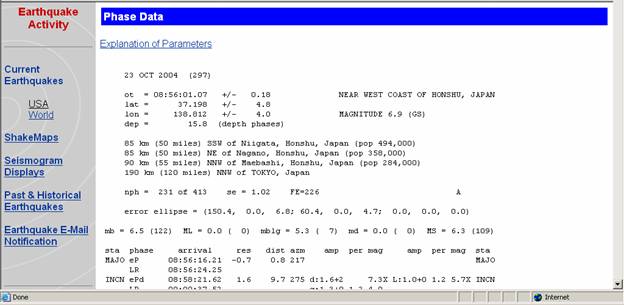
Figure 21. Phase data for the
![]()
4.
USGS Catalog Search (for historical data from earthquake.usgs.gov, click on “Science and Technology”, then on “World National Earthquake Information Center
(NEIC)” under “Earthquake Catalog and Seismic Data”, then “Global...”, “Rectangular...” or “Circular...”
and enter data for event search; an earthquake list will be produced; to see
all magnitude information, choose “Expanded
File Format…”, otherwise select “Screen
File Format…”): An online search
of the official USGS catalogs for historical earthquake information can be
performed at the from the USGS earthquake page (earthquake.usgs.gov, Figure 17). Several catalogs are available for the search
and the search can be global (worldwide), limited to a rectangular area (within
a latitude/longitude range), or circular (earthquakes within a specified
distance of a location). The search can
also specify a range of dates, magnitudes and depths of events, so that the
user can design a search for specific purposes.
The search can include data up to the current date although the most
recent earthquake data may be provisional and are subject to revision (usually
within a few days). The results of the
search are a list of earthquakes that can be viewed and copied into other
programs such as word processor documents or spreadsheets. To access the catalog search, select Science and Technology (upper right
corner) from the USGS earthquake page.
On the resulting page (Figure 22), in general, select World –
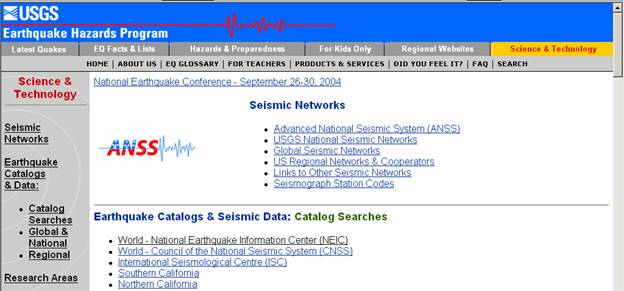
Figure 22. Screen that opens
from the USGS earthquakes page after selecting Science and Technology.
4.1
Catalog search, Global (Worldwide) example:
After selecting the World –
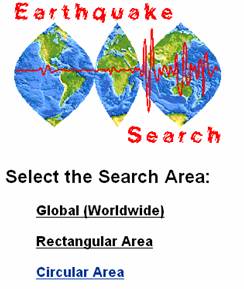
Figure 23. Selecting “
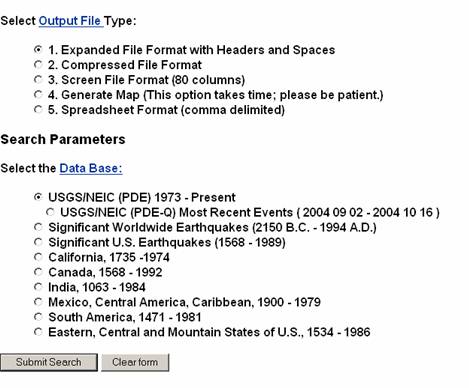
Figure 24. Output file and search parameter options for
the global search. In this case the
Expanded File Format and the 1973-Present catalog were selected.
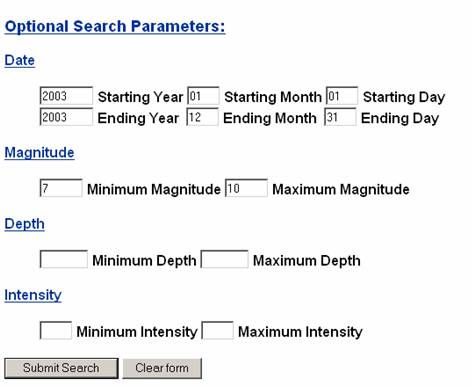
Figure 25. Optional search
parameters for the global search. In
this example, the time period from
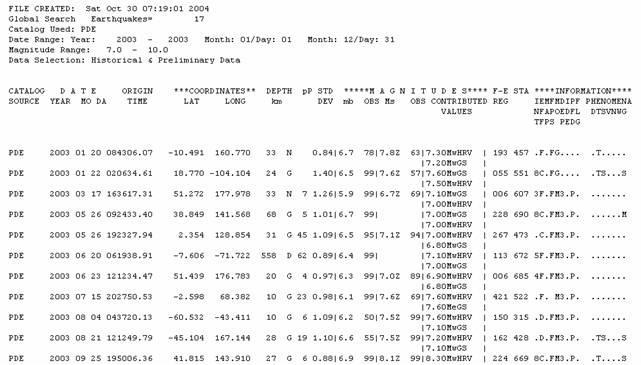
Figure 26. Results of the search
(only part of the list is shown here) illustrated in Figure 25. Seventeen earthquakes of M7 and greater
occurred during 2003. Origin time,
location, depth and magnitude information are listed for each earthquake.
Earthquake Facts and Statistics
Frequency of Occurrence of Earthquakes
|
Descriptor |
Magnitude |
Average Annually |
|
Great |
8 and higher |
1 ¹ |
|
Major |
7 - 7.9 |
17 ² |
|
Strong |
6 - 6.9 |
134 ² |
|
Moderate |
5 - 5.9 |
1319 ² |
|
Light |
4 - 4.9 |
13,000 |
|
Minor |
3 - 3.9 |
130,000 |
|
Very Minor |
2 - 2.9 |
1,300,000 |
|
¹ Based on observations since
1900. |
||
The USGS estimates that several million earthquakes occur in the
world each year. Many go undetected because they hit remote areas or have very
small magnitudes. The NEIC now locates about 50 earthquakes each day, or about
20,000 a year.
Figure 27. Worldwide frequency of occurrence of earthquakes
of various magnitude ranges from the USGS.
This information (and additional earthquake statistics) can be accessed
using the link How Many Earthquakes?
Located at the bottom of the Global
Search page (Figure 25) or directly at: http://neic.usgs.gov/neis/eqlists/eqstats.html.
![]()
4.2
Catalog search, Rectangular Area example:
Performing a catalog search for a rectangular area is similar to the
worldwide search described in section 4.1, above, except that a rectangular
area is selected using latitude and longitude ranges. As an example (similar to the Event Search
example in section 2.2, above), we select an area the includes
the northern part of South America, Central America and most of North America
(latitude -15 to 55 degrees; longitude -165 to -65 degrees). We also select earthquakes of magnitude 6 and
above that occurred in the search area from
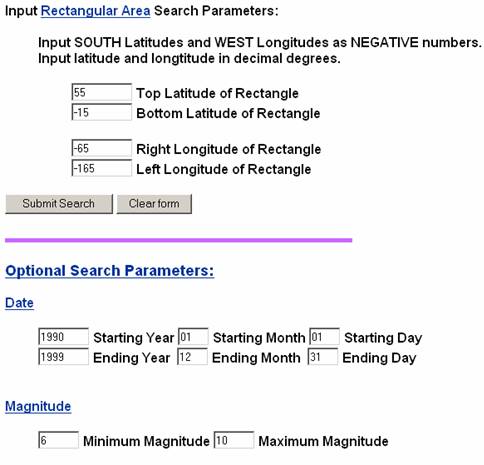
Figure 28. Optional search
parameters for the rectangular area search.
In this case, we specify a search for earthquakes in the area -15 to 55
degrees latitude and -165 to -65 degrees longitude (northern South America,
Central America and part of North America), for the time period January 1, 1990
to December 31, 1999, and earthquakes of magnitude 6 and greater.
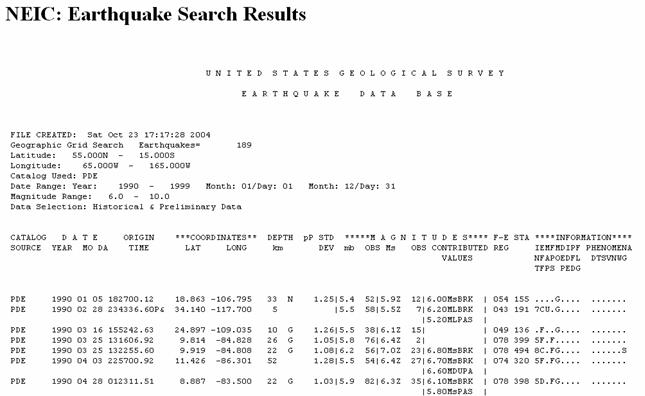
Figure 29. A part of the list
resulting from the rectangular area search shown in Figure 27. Origin time, location, depth and magnitude
information are listed for each earthquake.
![]()
[1]  Last
modified March 13, 2006
Last
modified March 13, 2006
The web page for this document is: http://web.ics.purdue.edu/~braile/edumod/eqdata/eqdata.htm.
Funding for this development provided by IRIS and the National Science Foundation.
ã Copyright 2003-4. L. Braile. Permission granted for reproduction for non-commercial uses.