|
|
12. Adding topographic data to SeisVolE and earthquake and volcano mapsÓ |
|
|
Lawrence W. Braile, Professor
Department of Earth and Atmospheric Sciences Purdue University West Lafayette, Indiana Sheryl J. Braile, Teacher Happy Hollow School West Lafayette, Indiana January
14, 2002 |
Objective: Learn how to add topographic data to the SEISVOLE folder and use the data to produce shaded terrain (also called shaded relief) maps with the SeisVolE program. These shaded terrain maps form a useful and attractive background to the earthquake and volcano activity displays that are produced by Seismic/Eruption. Several topographic data and display options are available.
Information: SeisVolE uses three topographic data sources
to create shaded terrain topography images for the maps shown in the main
SeisVolE screen. The three types of
data, their grid spacing (interval between data or elevation points), and the
area of coverage are:
|
Terrain data |
Grid interval (latitude –
longitude) |
Approximate grid interval (km) |
Area of coverage |
Bathymetry data |
|
etopo5 |
5 minutes |
8 |
Entire world |
Yes |
|
topo30 |
30 seconds |
0.8 (800 m) |
Conterminous US |
No |
|
3 second |
3 seconds |
0.080 (80 m) |
Selected areas |
No |
The standard views in SeisVolE have saved
shaded terrain files derived from the 5-minute, 30-second and 3-second
files. To utilize an alternative
terrain file for a standard view (for example, to show bathymetric data in an
oceanic area where the standard view utilizes the 30-second file, and therefore
does not include bathymetry), or to add terrain data to a “Make Your Own Map”
display, you will need the etopo5 and topo30 topographic data files. The 5-minute (~8 km spacing) topographic
data are available for the entire world and include bathymetric (depth below
sea level for the ocean areas) data.
These data are available in the etopo5 file (see Teaching
Module 1
for information on downloading the etopo5 topographic data).
The 30-second (~800 m spacing) topographic data are available for the
conterminous United States and do not include bathymetric data. These data are available in the topo30 file (see Teaching Module 1 for
information on downloading the topo30 topographic
data). Some other areas of the world
(Alaska, Kuriles and Kamchatka, and Indonesia) have standard views that
utilized the 30-second terrain data.
However, because global, 30-second data are not included in SeisVolE (or
the topo30 file), one cannot
display all areas of the world with 30-second terrain data or use these data
for “Make Your Own Map” displays (outside of the conterminous US). Global 30-second terrain data (for land
areas) are now available on CD-ROM or from the Internet (GLOBE Program; www.ngdc.noaa.gov), but the file is
very large (about 1.8 GB). For more
information on the shaded terrain data and the capabilities for use with
SeisVolE, see the SeisVolE Help (Help, Contents, Menu, Shaded Terrain). A few, selected standard views (Loma Prieta,
Northridge, Cook Inlet, Mammoth Lakes) in SeisVolE have been created using
3-second (about 80 m grid interval) data for higher resolution for relatively
small areas.
Adding or Changing Shaded Terrain
Data: After the etopo5 and topo30 files have been
added to your SEISVOLE folder, you can change the shaded terrain data to get a
better topographic background (if the topo30, equivalent or 3-second data are not already being used in
a standard view). This capability is
particularly useful for areas of the conterminous US where the 30-second data
are available and you are using the “Make Your Own Map” option (see Teaching Module 11). One can also use this capability if the
background screen comes up blank or one wants to change the default elevation
file (for example, to see bathymetry [using etopo5] for the standard views where 30-second data have been
used). To make changes in the shaded
terrain files:
1. Select Shaded Terrain, Digital Elevation Models from the Map menu.
2. A dialog box will appear; in the upper left hand corner click on:
World 5-minute DEM (ETOPO5), if the area is outside the US, or,
USA 30-second DEM (TOPO30), if the area is in the conterminous US and you have added the topo30 elevation file (to the TOPO folder within the SEISVOLE folder).
3. In the lower left hand corner of the dialog box, be sure that the boxes to
the right of ETOPO5 and TOPO30 look like the following:
ETOPO5 \seisvole\topo\etopo5.
TOPO30 \seisvole\topo\topo30.
If you installed your SeisVolE program in another location (not the C:\ drive) such as the D:\ drive, then the entries should be:
ETOPO5 d:\seisvole\topo\etopo5.
TOPO30 d:\seisvole\topo\topo30.
Examples of SeisVolE Maps with
Shaded Terrain: To illustrate the
appearance and varying resolution of the different terrain data, the following
maps have been prepared with SeisVolE using different terrain data and
displaying areas of various size. To
better emphasize the map and terrain, the legend and other information adjacent
to the maps on the SeisVolE screen views have been removed by cropping the
screen images (.bmp files created
using the Options, Make Bitmap control; see Teaching Module 2) in MS Word. To crop an image in MS Word, select the image (after importing
using the Insert, Picture, From File… commands) by
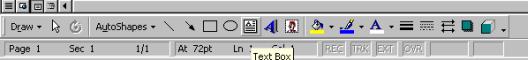
clicking on it with the mouse. The Picture Toolbar (shown below)
will become active (if the Picture Toolbar is not visible in the upper right
corner of your Word screen, select View, Toolbars, Picture to add the Picture Toolbar to your
screen). Click on the Crop tool (looks like two right

angles) and use it to drag the small
squares along the sides of the selected image until the image is reduced to
include only the information of interest.
The map (image area can be reduced or enlarged on the screen by
selecting the image and then dragging one of the corners to obtain the desired
size. The size of the area that has
been included in the maps is evident from the kilometer scale that is shown in
the lower left hand corner of the map.
Lines, arrows and titles (using the Text Box tool) can be added to the cropped figure using the MS Word
Picture tools.
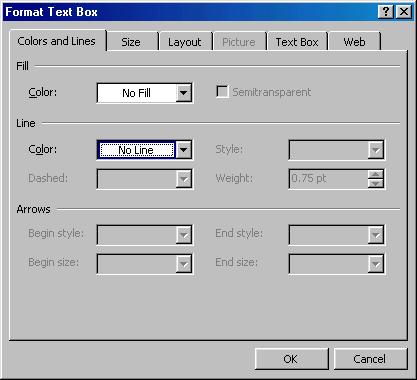
After typing your text in the Text Box, one can change the Fill and Line properties of the Text
Box by
selecting the Text Box and then selecting Text Box… from the Format menu. The dialog
box below will appear allowing changes in the Fill and Line properties, including No Fill and No Line (chosen for the Text Box in Figure 12.1).
The color of the text can be changed by highlighting the text with the
mouse and then selecting the color from the Font Color tool (below).
![]()
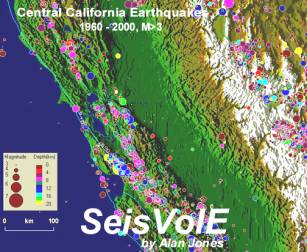
Figure 12.1 shows a SeisVolE map for the southwestern US created using the
etopo5 (~8 km grid) terrain data.
Southwestern United States Earthquakes, 1960
– 2001, M5+
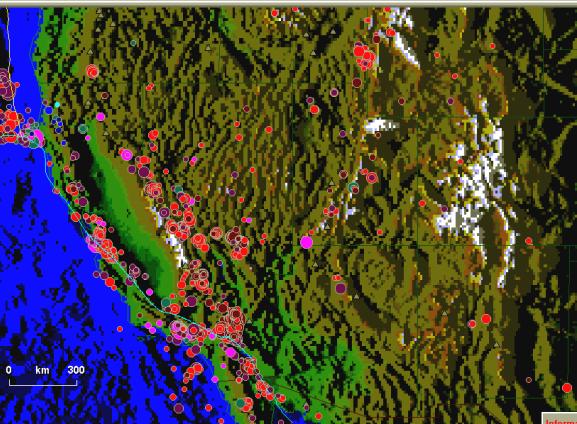
Figure 12.1. SeisVolE map of earthquakes in the southwestern US, 1986 – 2001. Background shaded terrain map utilized the etopo5 topographic data (~8 km grid). The map has been cropped using the MS Word Picture tool and a title has been added using the Textbox tool.
For comparison, the same area is displayed in Figure 12.2 using the topo30 (~800 m grid) terrain data. Note that, for this size area, the higher resolution elevation data produces a much better shaded terrain map.
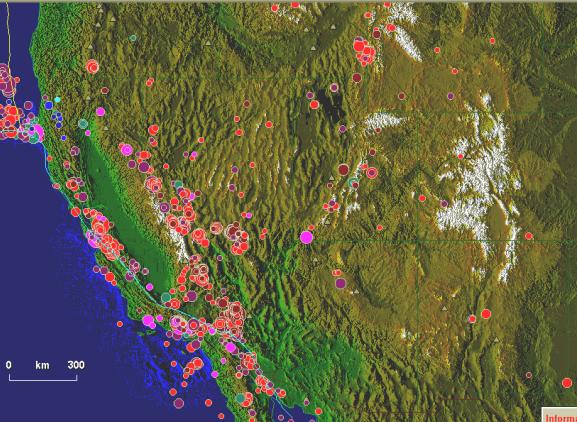
Figure 12.2. SeisVolE map of earthquakes in the southwestern US, 1986 –
2001. Background shaded terrain map utilized
the topo30 topographic data (~800 m grid).
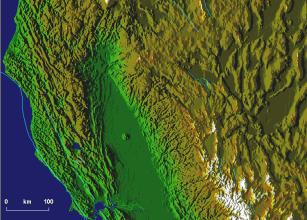
Focusing on a somewhat smaller area, Figure 12.3 shows a SeisVolE map of California and Nevada using the etopo5 terrain data. For comparison, Figure 12.4 shows the same area using the topo30 terrain data and Figure 12.5 shows the same area displayed with no shaded terrain.
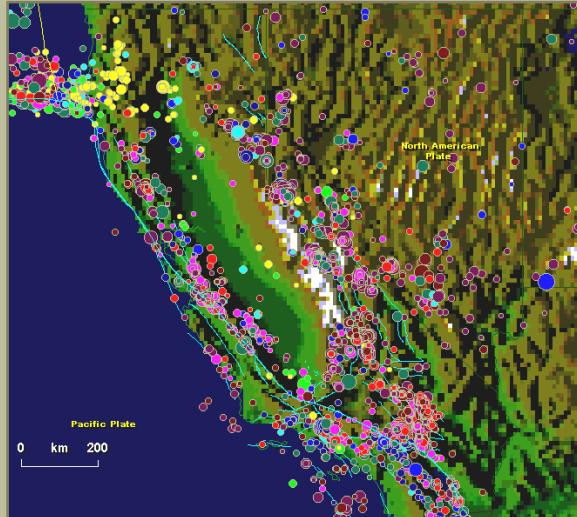
Figure 12.3. SeisVolE map of earthquakes in California and Nevada, 1992 – 2001. Background shaded terrain map utilized the etopo5 topographic data (~8 km grid).
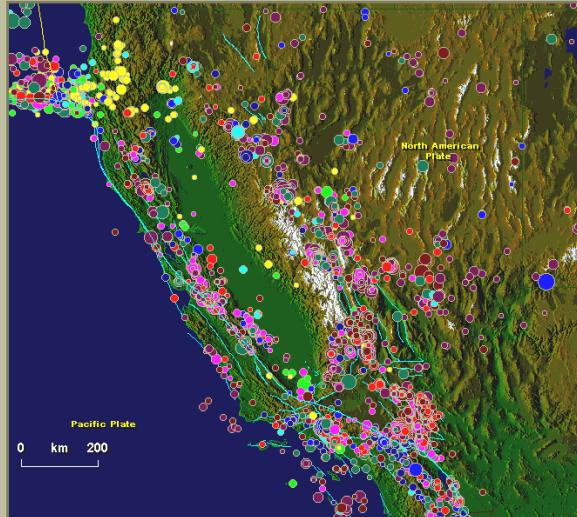
Figure 12.4. SeisVolE map of earthquakes in California and Nevada, 1992 – 2001. Background shaded terrain map utilized the topo30 topographic data (~800 m grid).
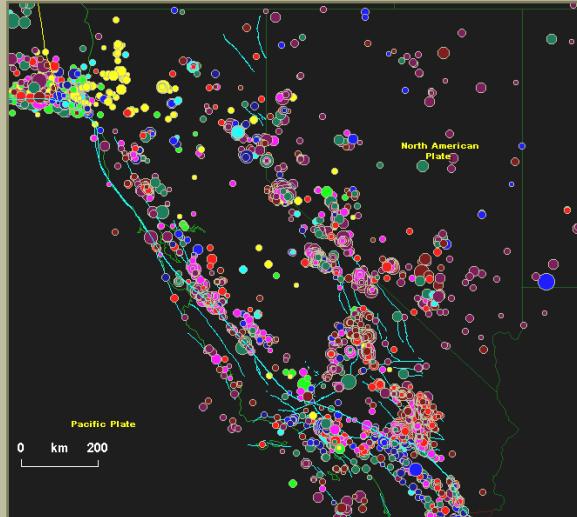
Figure 12.5. SeisVolE map of earthquakes in California and Nevada, 1992 – 2001. The shaded terrain map has been turned off using the Map, Shaded Terrain option.
An
additional comparison of the terrain data is provided in Figure 12.6 for a
fairly small area. The maps show the
epicenter of the 1994, M6.8 Northridge earthquake and some of the aftershocks
of this event. The map on the right is
from one of the SeisVolE standard views (Northridge, California 1994) and used
3-second (~80 m grid) elevation data. The
map on the left shows the same area using the top30 (~800 m grid) terrain
data. For “close-up” views such as this
one, the higher resolution 3-second data are significantly better. However, making these data available for all
areas of the world is impractical, so only the topo30 data are provided for the
conterminous US and the etopo5 data for the entire world. Additional standard views of relatively
small areas that use the 3-second terrain data are: Loma Prieta, California;
Mammoth Lakes, California; Cape Mendocino 1992 Events, California; Cook Inlet,
Alaska; and Hawaii. For more
information on terrain data and availability of terrain files, see the SeisVolE
Help (Help, Contents, Menu, Shaded Terrain).
|
|
|
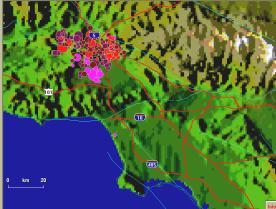
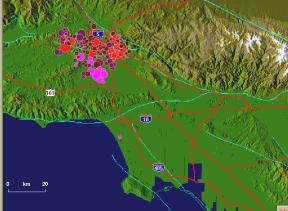
Figure 12.6. SeisVolE map the Northridge earthquake (January 17, 1994, M6.8, Northridge, California) and its aftershocks (through January 24, 1994). The map on the left uses the topo30 (30-second, ~800m grid) terrain data. The map on the right uses the 3-second (~80 m grid) terrain data.
Investigating the relationships between earthquakes, volcanoes and topography: Because earthquake activity, volcanic eruptions and topography are all related to plate tectonics, the connections between earthquake epicenter patterns, volcano locations and topography are visible nearly everywhere in the world. One can observe these relations on almost every standard view in SeisVolE and in “Make Your Own Map” images. Because the topography (represented in shaded terrain color images) in SeisVolE displays is often “covered” by the colored dots of earthquake epicenter after the view is completed (earthquakes through time are displayed), it is convenient to use the pause button (or repeat and then pause) at the bottom of the screen to freeze the display before epicenter are displayed. Using this method, one can examine the topography of the view before observing the locations of earthquakes and volcanoes. The following figures and questions are intended to provide suggestions and examples for investigating the relationships between earthquakes, volcanoes and topography.
12.1 Open the
South America standard view in SeisVolE (you can zoom in on the continent to
produce a more clear image using “Make Your Own Map” as shown in Figure
12.7). Pause the image to observe the
topography of the continent, particularly the Andes Mountains along the west
coast. Then, view the earthquakes and
volcanic activity through time (click Play or Repeat). Where are most of the earthquakes
located? What is the depth (use the
color code in the legend to the right of the map) of the earthquakes? Where are the active volcanoes? To see additional details of the earthquake
and volcano locations and the topography, you can zoom in further on an area,
such as the central Andes Mountains shown in Figure 12.8.

Figure 12.7. Earthquakes, volcanic eruptions and topography in South America. The Magnitude/Depth scale has been modified(under the Earthquakes menu) to scale the largest dot size (corresponding to magnitude 8) to 4.
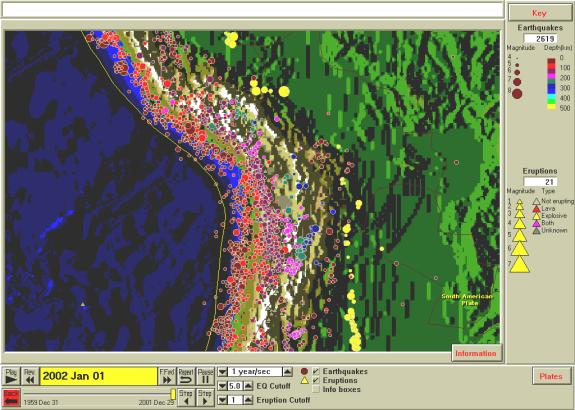
Figure 12.8. Close-up view of earthquakes, volcanic eruptions and topography in the central Andes Mountains region of South America.
12.2 The
relationship between earthquakes, volcanoes and topography is also visible in
other areas of the world. For example,
in central and southern Asia (Asia standard view in SeisVolE and Figure 12.9),
many earthquakes occur in the mountainous regions (Himalayan Mountains – the
highest mountain range in the world – and adjacent ranges) north of India. Where do most of the earthquakes and
volcanoes occur? What are the depths of
the earthquakes north of India? Note
that, unlike South America in the previous example, the earthquakes north of
India are not adjacent to a continental margin. What plate tectonic process or event is the cause of the
earthquake activity (and high topography) north of India? Why are there no volcanoes in this region?
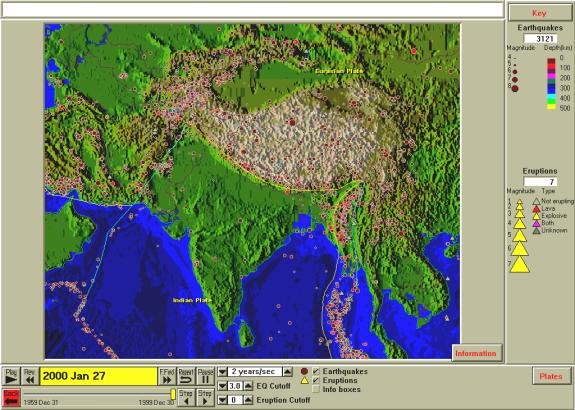
Figure 12.9. Earthquakes, volcanic eruptions and topography in central Asia. The Magnitude/Depth scale has been modified(under the Earthquakes menu) to scale the largest dot size (corresponding to magnitude 8) to 4.
12.3 The
locations of earthquakes and volcanoes in oceanic areas also display a
correlation to ocean bottom topography (bathymetry), and plate tectonics. Earthquakes are very common along the
volcanic arcs of the “Pacific Ring of Fire”.
A good example is the activity along the Aleutian Islands volcanic arc
(Figure 12.10). Where are earthquakes
and volcanoes located in the Aleutian Islands arc (or other volcanic arc such
as Kuriles-Kamchatka, Japan, the Philippines, Tonga-Fiji, Indonesia,
etc.)? What are the depths of these
earthquakes? What kind of volcanic
activity is associated with the volcanic arcs?
For example, are the volcanoes steep-sided cones (composite or strato-volcanoes)
similar to Mt. St. Helens, Mount Pinatubo, or Mount Fuji, or are they mostly
fluid basaltic eruptions similar to the volcanic activity in Hawaii? Can you find a trench (deep trough in the
ocean floor; colored dark blue in the shaded terrain displays) associated with
the earthquakes and volcano locations in these volcanic arcs (such as in the
Aleutians, Figure 12.10; note that a similar trench is visible adjacent to the
west coast of South America, Figures 12.7 and 12.8)? Where is the trench in relation to the earthquake activity? If there are deep earthquakes in the seismic
zone, where are they in relation to the trench? What is the cause of the trench?
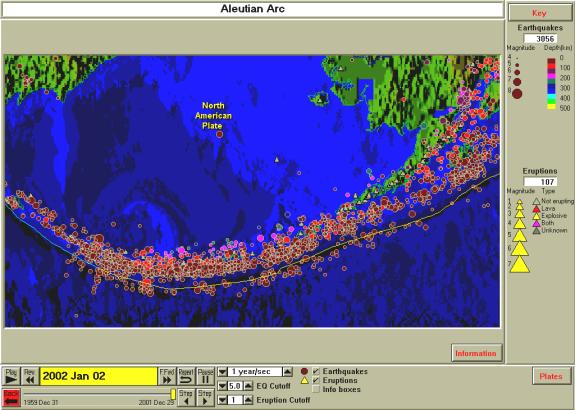
Figure 12.10. Earthquakes, volcanic eruptions and topography in Aleutian Islands, Alaska. Depth below sea level (bathymetry, or topography of the ocean bottom) is represented by shades of blue – lighter shades of blue are shallow depths, darker shades of blue are deeper.
12.4 Earthquakes,
volcanoes and topography are also related in the central areas of most of the
world’s oceans. For example, an area of
the North Atlantic Ocean is shown in Figure 12.11 (from the Atlantic Ocean
standard view in SeisVolE). For this
area (or some other mid-ocean region) where are most of the earthquakes and volcanoes
located? Are the earthquakes deep or
shallow? Notice the broad high
topography area (mid-ocean ridge; lighter blue color in the shaded terrain
image) and adjacent deep (abyssal plain; dark blue color in the shaded terrain
image) regions. Why do earthquakes
occur along the mid-ocean ridges, near the center of the ocean basin?
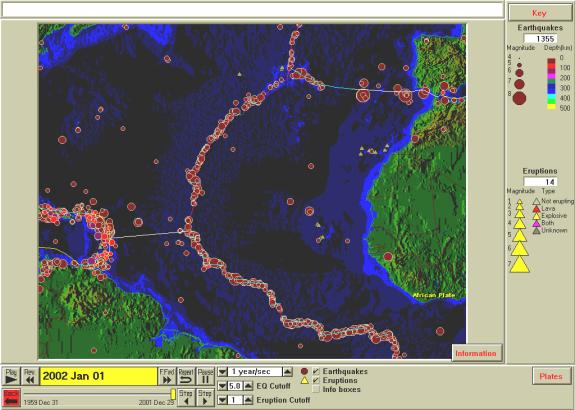
Figure 12.11. Earthquakes, volcanic eruptions and topography in a portion of the Atlantic Ocean. Depth below sea level (bathymetry, or topography of the ocean bottom) is represented by shades of blue – lighter shades of blue are shallow depths, darker shades of blue are deeper.
12.5 Can you
find areas in the world that are seismically active but not volcanically
active? What are the topographic and
plate tectonic characteristics of these areas that distinguishes them from the
areas that we examined above?
12.6 Can you find low-topography (not mountainous) areas in the world that are seismically active?
12.7 Can you find mountainous areas of the world that are not seismically or volcanically active? How might these areas be related to plate tectonics? Hint: Could these areas have been seismically and volcanically active at some previous time?
Go to
List of SeisVole Teaching Modules (in Introduction to SeisVolE
Teaching…; Module 0)