|
|
14. Making cross-section diagramsÓ
|
|
|
Lawrence W. Braile, Professor
Department of Earth and Atmospheric Sciences Purdue University West Lafayette, Indiana Sheryl J. Braile, Teacher Happy Hollow School West Lafayette, Indiana January
16, 2002 |
4. Making a Cross-Section
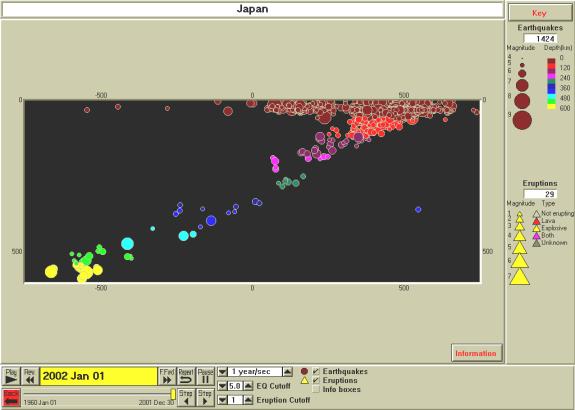
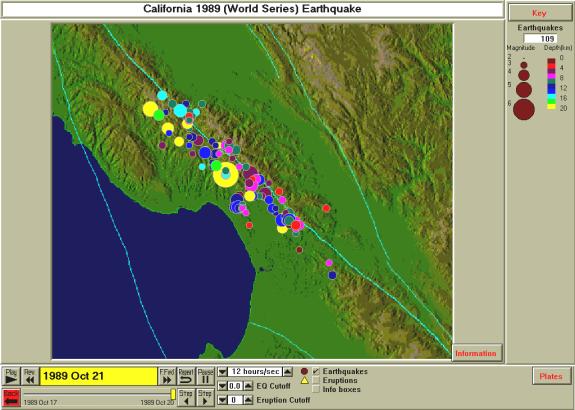
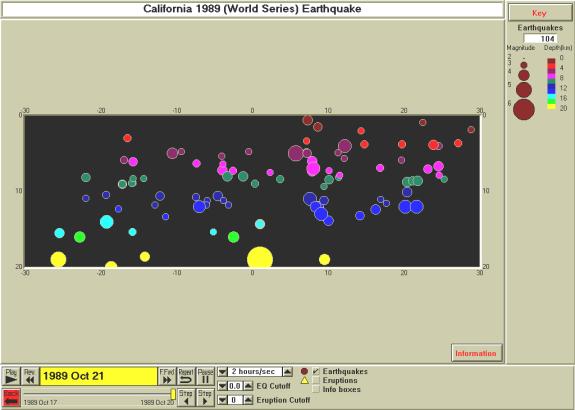
a. Select a view or make your own map.
b. Run the map (view earthquakes and/or eruptions through time); note the depth extent of the hypocenters; set Magnitude/Depth Scale in the Earthquakes menu (for subduction zones, normally, set the maximum depth to 500 or 750 km).
c. Select the Set Up Cross-Section View from the Control menu.
d. Click on the map; a red profile will appear on the map and a rectangular area with data boxes and buttons will appear near the bottom of the screen.
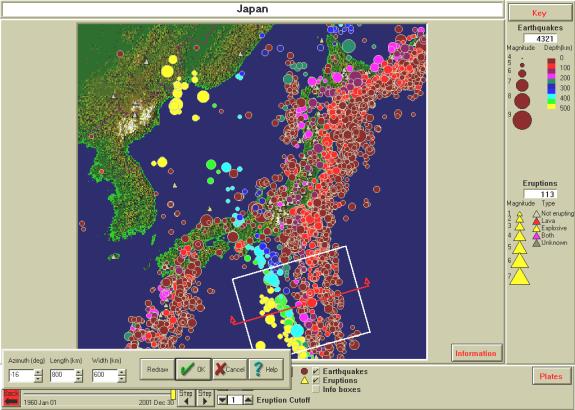
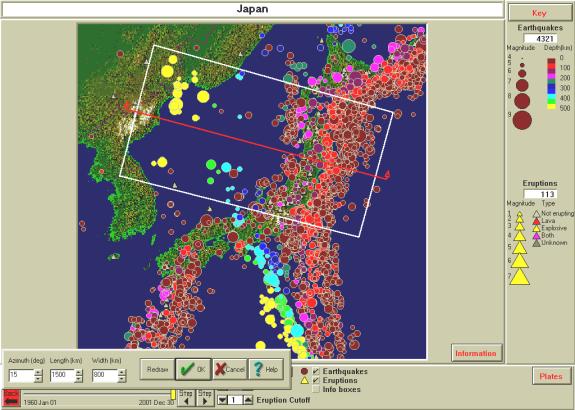
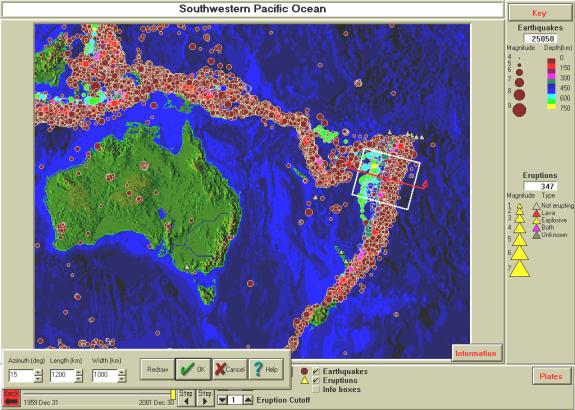
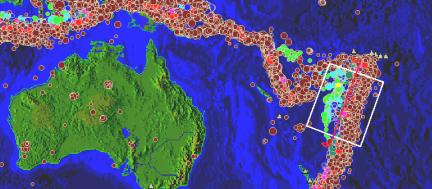
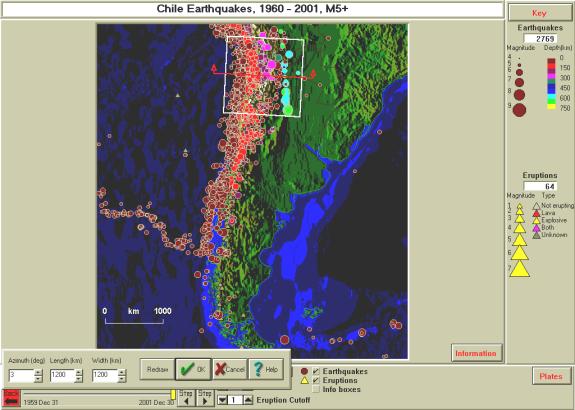
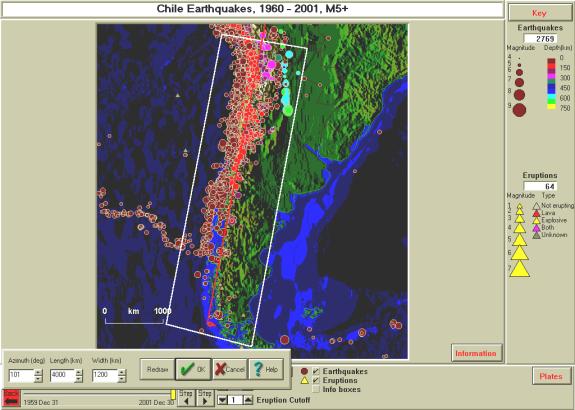
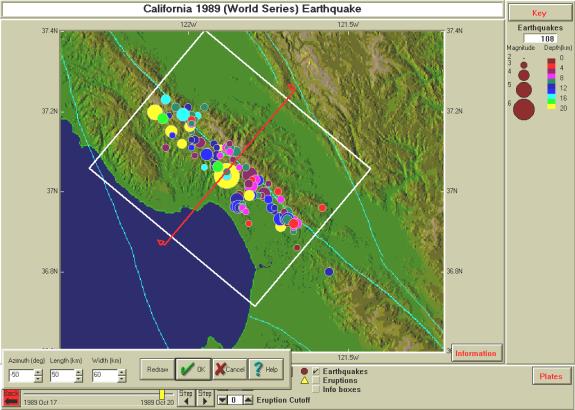
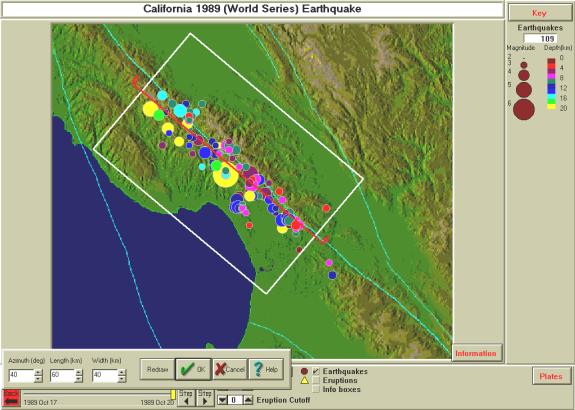
e. Adjust Azimuth, profile Length, and profile Width (hypocenters within the white rectangular area will be projected onto the profile); use the arrows to adjust the azimuth, when you stop clicking on the arrows, the red profile will rotate on the map to the new orientation; highlight the Length and Width values and type in new values; click Redraw to view the profile; adjust azimuth, length and width until satisfied; click on the red profile, hold down the left mouse button and drag the profile into the desired position; click OK; see example below:
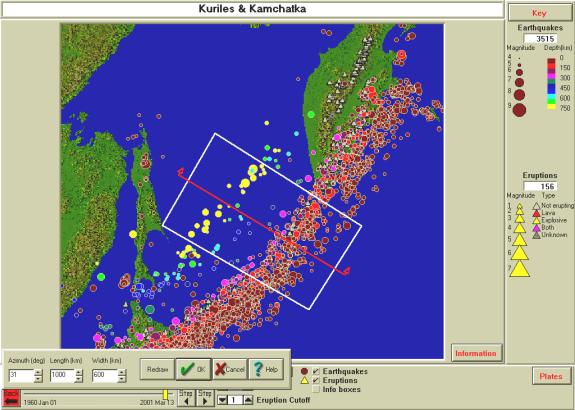
Profile (red line) and area (white rectangle) of epicenters to be
projected onto the profile for a cross-section view. Profile azimuth, profile length and profile width values are
given in the data boxes at bottom left.
The area/view is the Kuriles and Kamchatka standard view. Earthquake depths are color-coded according
to the depth scale in the upper right.
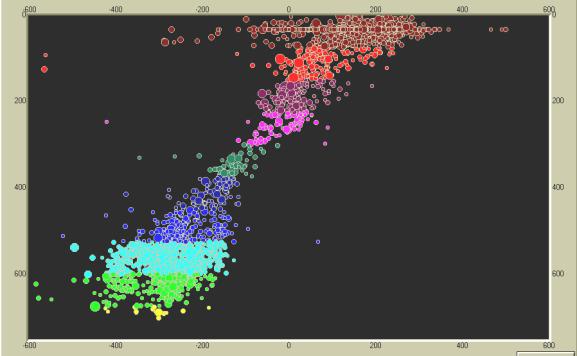
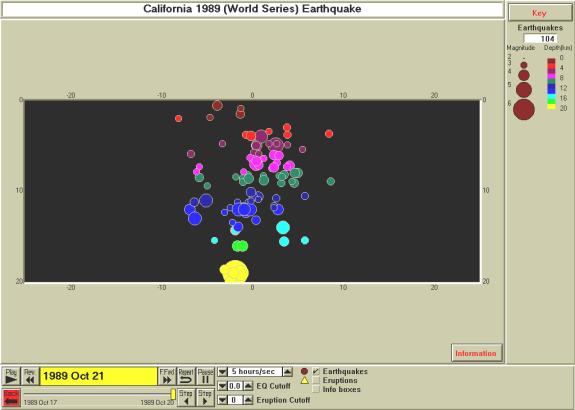
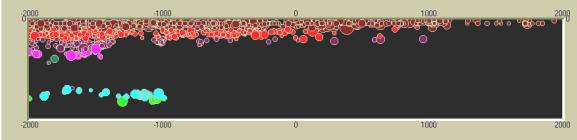
f. In the Control menu, click on MapView/3D/Cross-Section and then on Cross-Section View.
g. Run the map (view earthquakes and/or eruptions through time); an example is shown below:
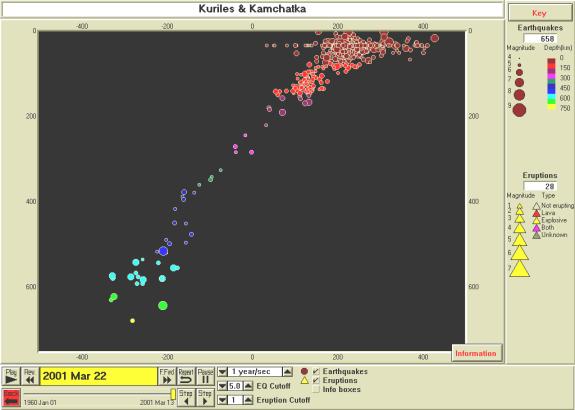
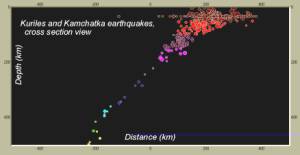
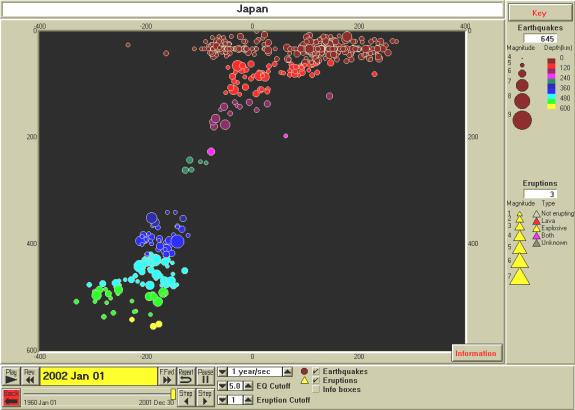
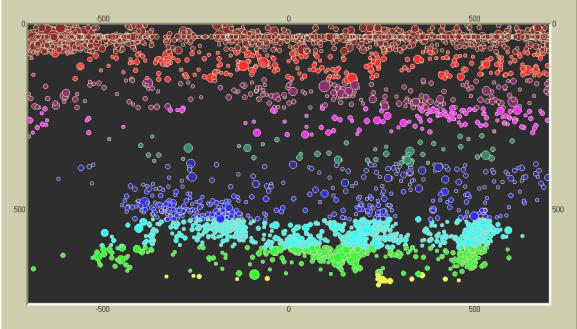
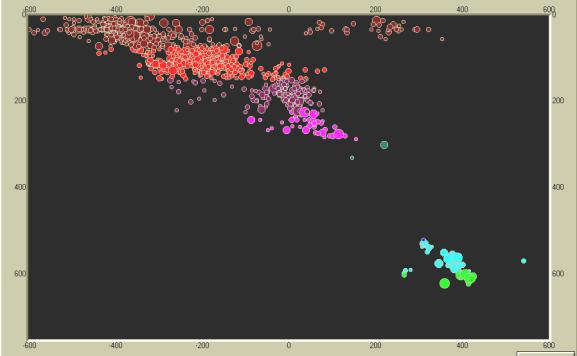
Cross-section view showing hypocenters corresponding to the epicenters shown in the white rectangle in the view shown above. Hypocenters are color-coded according to the depth scale in the upper right. The vertical scale is depth in km. The horizontal scale is distance along the profile in km. The profile is oriented from NW (on the left) to SE (on the right).
h. To save the view select Save View As from the File menu.
i. To save the image to print or export to another document, select Make Bitmap from the Options menu. Save the Bitmap file in the SEISVOLE folder or other location. This file can be imported into an MS Word document or an image processing program such as Adobe Photo Deluxe.
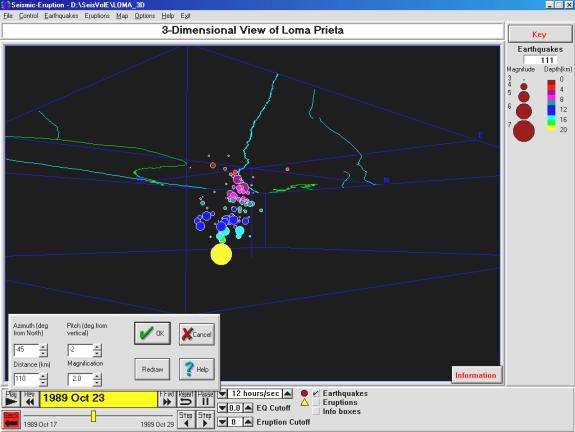
Select view or make your own map
Control, MapView/3-D/Cross Section, 3-D View
Save View As, use 3D in title
Control, Interactive (3D), adjust Az, Pitch (neg is view from below surface), Dist, Mag
Click Ok to redraw with colored circles for hypocenters
Save View As (same filename) if you want to save updated view parameters
Go to List of SeisVole Teaching Modules (in Introduction to SeisVolE Teaching…; Module 0)