|
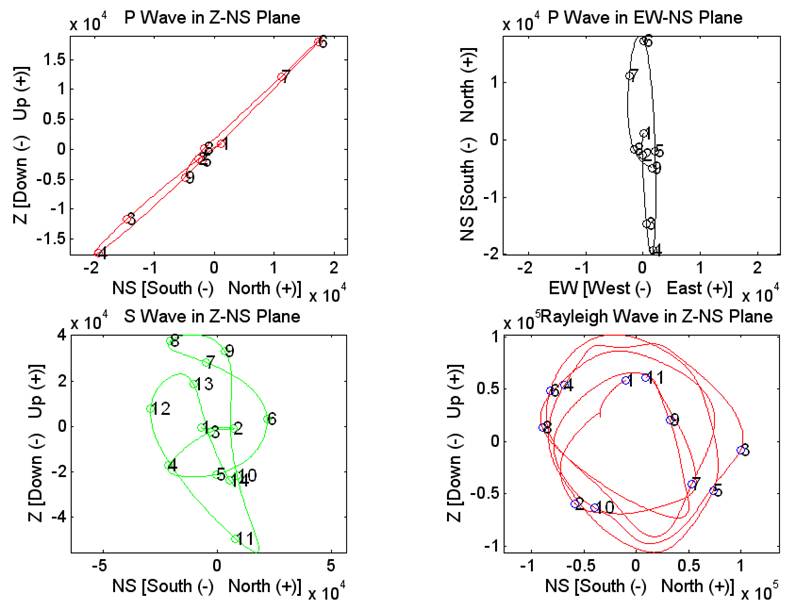
Particle motion diagrams for selected seismic waves
from the example seismograms. Plots
illustrate the particle motion by plotting seismograms for two components of
motion, one component on the horizontal axis and one component on the
vertical axis (two horizontal components for the diagram in the upper
right). The relative amplitude of
ground motion in each direction is indicated by the axis labels. Numbered circles on the particle motion
plots show successive times (every 1 second beginning at 17:42:07 UTC/GMT
time for the P wave particle motion plots – 8 s record; every 2 seconds
beginning at 17:45:33 UTC/GMT time for the S wave particle motion plot – 26 s
record; and every 10 seconds beginning at 17:46:30 UTC/GMT time for the
Rayleigh wave particle motion plots – 100 s record). P-wave particle motion is shown for the
Z-NS plane (upper left graph) and for the EW-NS plane (upper right
graph. S-wave particle motion is shown
for the Z-NS plane in the graph at the lower left. Rayleigh-wave particle motion is shown for
the Z-NS plane in the graph at the lower right.
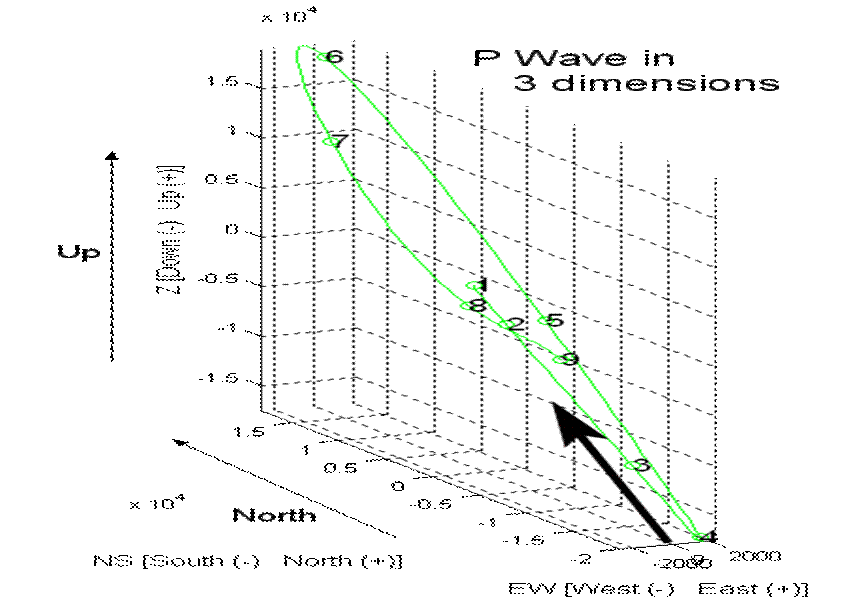
Particle motion diagram for the P wave from the example
seismograms. Three-D perspective plot
illustrates the particle motion by plotting seismograms for three components
of motion, two components on the horizontal axes and one component on the
vertical axis. The relative amplitude
of ground motion in each direction is indicated by the axis labels. Numbered circles on the particle motion
plot show successive times (every 1 second beginning at 17:42:07 UTC/GMT time
for the P wave particle motion – 8 s record).
The bold arrow shows the approximate direction (ray path) of the P
wave energy arriving at the seismograph station. |