Information
and data regarding the 2015 earthquake in Nepal
Gerald Shively, Purdue
University
![]() shivelyg@purdue.edu
shivelyg@purdue.edu
![]() +1 765 494 4218
+1 765 494 4218
![]() +1 765 494 9176
+1 765 494 9176
![]() @ProfShively
@ProfShively
I am maintaining this page and
updating it frequently with information regarding the April 25 and May 12
earthquakes in Nepal. My goal is to provide useful facts and
information for rapid dissemination that may not be easily found elsewhere.
Please send any comments, corrections or suggestions for links to shivelyg@purdue.edu. The relevant Twitterfeed at the moment appears to be #NepalQuake. A useful “one stop” centralized portal containing
information, live news and links to relief efforts is available from Youth in Action.
Thanks to everyone who attended the Purdue candlelight vigil on April 29th
at the Engineering Fountain. The Purdue Exponent story is linked here.
CNN and The
Guardian provide comprehensive lists of relief organizations for donations:
http://www.cnn.com/2015/04/25/world/nepal-earthquake-how-to-help/index.html
http://www.theguardian.com/global-development/2015/apr/27/nepal-earthquake-how-you-can-help-donate-aid
|
19 May |
The news from Nepal
has been relatively quiet for a few days. UN
Situation Report 15 was issued on 15 May and Report
16 was issued yesterday. Although there have been a few reported
instances of tensions and protests surrounding the disbursement of aid and
assistance, public security seems OK at this point and efforts appear to be
focusing on coordination of interventions, especially those directed at
setting up temporary shelters and camps. Unfortunately, one can easily
envision dozens of these make-shift temporary camps becoming permanent
settlements. One only look to Haiti, to see the potential for problems: five years
after Haiti’s 7.0 Mw earthquake, it is estimated
that 170,000
people are still living in tents. |
||||||||||||||||||||||||||||||||||||||||||||||||||||||||||||||||||||||||||||||||||||||||||||||||||||||||||||||||||||||||||||||||||||||||||||||||||||||||||||||||||||||||||||||||||||||||||||||||||||||||||||||||||||||||||||||||||||||||||||||||||||||||||||||||||||||||||||||||||||||||||||||||||||||||||||||||||||||||||||||||||||||||||||||||||||||||||||||||||||||||||||||||||
|
15 May |
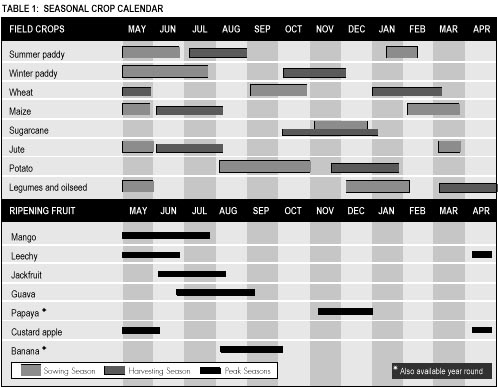
As I suggested more
than a week ago, the greatest risk at the moment seems to be the risk of not planting
next year’s crops before monsoon rains arrive. Once this “planting window” closes, the
opportunity to generate harvests for next year’s food needs will be past, and
food aid will be the only pathway available to avert widespread hunger 6-9
months from now. The FAO’s crop calendar
for Nepal indicates that May and June are the primary sowing months for several
of Nepal’s main crops, including paddy rice, maize, and legumes.
Source: FAO (http://www.fao.org/docrep/v2670e/v2670e02.htm). |
||||||||||||||||||||||||||||||||||||||||||||||||||||||||||||||||||||||||||||||||||||||||||||||||||||||||||||||||||||||||||||||||||||||||||||||||||||||||||||||||||||||||||||||||||||||||||||||||||||||||||||||||||||||||||||||||||||||||||||||||||||||||||||||||||||||||||||||||||||||||||||||||||||||||||||||||||||||||||||||||||||||||||||||||||||||||||||||||||||||||||||||||||
|
14 May |
As indicated in
yesterday’s UN
Situation Report 14 (13 May) aftershocks continue to hamper relief efforts.
Many villages remain inaccessible due to landslides, and heavy rain in some
districts are frustrating debris removal and emergency response. |
||||||||||||||||||||||||||||||||||||||||||||||||||||||||||||||||||||||||||||||||||||||||||||||||||||||||||||||||||||||||||||||||||||||||||||||||||||||||||||||||||||||||||||||||||||||||||||||||||||||||||||||||||||||||||||||||||||||||||||||||||||||||||||||||||||||||||||||||||||||||||||||||||||||||||||||||||||||||||||||||||||||||||||||||||||||||||||||||||||||||||||||||||
|
13 May |
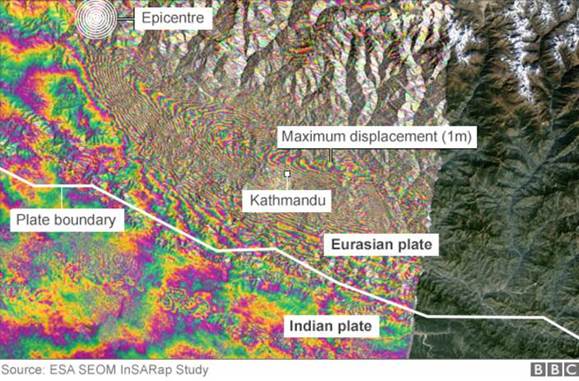
The following image,
from the
European Space Agency (as reproduced, augmented and reported by Jonathan
Amos, a BBC Science Correspondent), shows ground displacement from the
April 25th quake.
|
||||||||||||||||||||||||||||||||||||||||||||||||||||||||||||||||||||||||||||||||||||||||||||||||||||||||||||||||||||||||||||||||||||||||||||||||||||||||||||||||||||||||||||||||||||||||||||||||||||||||||||||||||||||||||||||||||||||||||||||||||||||||||||||||||||||||||||||||||||||||||||||||||||||||||||||||||||||||||||||||||||||||||||||||||||||||||||||||||||||||||||||||||
|
12 May |
A huge and tragic
set-back for Nepal, in the form of second quake on Tuesday afternoon (12:50pm
Nepal time). This one, magnitude 7.3, was centered 76km east-northeast of
Kathmandu. Here is the United States Geological Survey report.
This will clearly generate a new round of suffering and further frustrate
recovery and relief efforts. Sigh. |
||||||||||||||||||||||||||||||||||||||||||||||||||||||||||||||||||||||||||||||||||||||||||||||||||||||||||||||||||||||||||||||||||||||||||||||||||||||||||||||||||||||||||||||||||||||||||||||||||||||||||||||||||||||||||||||||||||||||||||||||||||||||||||||||||||||||||||||||||||||||||||||||||||||||||||||||||||||||||||||||||||||||||||||||||||||||||||||||||||||||||||||||||
|
11 May |
Although food stocks
have been severely affected in Nepal, food markets are showing some signs of
recovery, except in areas where pre-quake market infrastructure was already
very weak (e.g. the mountains). The UN
just produced a useful status
report, including some very informative maps. |
||||||||||||||||||||||||||||||||||||||||||||||||||||||||||||||||||||||||||||||||||||||||||||||||||||||||||||||||||||||||||||||||||||||||||||||||||||||||||||||||||||||||||||||||||||||||||||||||||||||||||||||||||||||||||||||||||||||||||||||||||||||||||||||||||||||||||||||||||||||||||||||||||||||||||||||||||||||||||||||||||||||||||||||||||||||||||||||||||||||||||||||||||
|
|
As
indicated in UN
Situation Report 13 (11 May), it is estimated that nearly one million children in Nepal “will not be able to return to school
unless urgent action is taken to assess schools in the affected districts and
provide temporary learning spaces” where schools have been destroyed. |
||||||||||||||||||||||||||||||||||||||||||||||||||||||||||||||||||||||||||||||||||||||||||||||||||||||||||||||||||||||||||||||||||||||||||||||||||||||||||||||||||||||||||||||||||||||||||||||||||||||||||||||||||||||||||||||||||||||||||||||||||||||||||||||||||||||||||||||||||||||||||||||||||||||||||||||||||||||||||||||||||||||||||||||||||||||||||||||||||||||||||||||||||
|
08 May |
|||||||||||||||||||||||||||||||||||||||||||||||||||||||||||||||||||||||||||||||||||||||||||||||||||||||||||||||||||||||||||||||||||||||||||||||||||||||||||||||||||||||||||||||||||||||||||||||||||||||||||||||||||||||||||||||||||||||||||||||||||||||||||||||||||||||||||||||||||||||||||||||||||||||||||||||||||||||||||||||||||||||||||||||||||||||||||||||||||||||||||||||||||
|
07 May |
|||||||||||||||||||||||||||||||||||||||||||||||||||||||||||||||||||||||||||||||||||||||||||||||||||||||||||||||||||||||||||||||||||||||||||||||||||||||||||||||||||||||||||||||||||||||||||||||||||||||||||||||||||||||||||||||||||||||||||||||||||||||||||||||||||||||||||||||||||||||||||||||||||||||||||||||||||||||||||||||||||||||||||||||||||||||||||||||||||||||||||||||||||
|
05 May |
UN
Situation Report 10 (04 May). As
the most recent UN situation report underscores, much of the response focus thus far has been on districts
and areas around Kathmandu. That’s
understandable, given the area’s population density and ease of access, but
remote districts and villages also need to be reached. As I have indicated
previously (see below) many mountainous regions were virtually cut-off from
the rest of the country before the earthquake, and now that weak transport
infrastructure has been further degraded, isolation is assured. There is a
small window of opportunity at the moment to provide assistance and to
deliver agricultural inputs such as seeds and fertilizer that will be
necessary for the next agricultural season. In approximately six weeks the monsoon rains
and stormy weather will arrive, at which point access to these remote areas
will be virtually impossible. Overall agricultural production, and
the ability of households to produce and purchase food, are factors strongly
correlated with long-term nutrition among children in rural Nepal. This
underscores the importance of paying attention to not just short-term relief,
but also long-term investment in Nepal’s agricultural sector. |
||||||||||||||||||||||||||||||||||||||||||||||||||||||||||||||||||||||||||||||||||||||||||||||||||||||||||||||||||||||||||||||||||||||||||||||||||||||||||||||||||||||||||||||||||||||||||||||||||||||||||||||||||||||||||||||||||||||||||||||||||||||||||||||||||||||||||||||||||||||||||||||||||||||||||||||||||||||||||||||||||||||||||||||||||||||||||||||||||||||||||||||||||
|
04 May |
As
indicated in UN
situation report 09 (02 May), the death toll in Nepal continues to climb,
and the risk of aftershocks remains high. As foreign correspondent John
Elliot points out in The
Independent, while the earthquake devastation itself has natural causes, it
must be recognized that Nepal’s vulnerability to the earthquake has been
building for decades, due to a general disregard on the part of many for
precaution and preparedness. Because Nepal sits in a prime earthquake zone,
and was hit with a large earthquake 80 years ago, this earthquake came as no
surprise to seismologists. Sadly,
political instability and past government failings have hampered efforts to
improve the situation. Fortunately, local and international response efforts,
including those of organizations like MercyCorps, Save
the Children, and the International Red
Cross are making a huge difference on the ground. |
||||||||||||||||||||||||||||||||||||||||||||||||||||||||||||||||||||||||||||||||||||||||||||||||||||||||||||||||||||||||||||||||||||||||||||||||||||||||||||||||||||||||||||||||||||||||||||||||||||||||||||||||||||||||||||||||||||||||||||||||||||||||||||||||||||||||||||||||||||||||||||||||||||||||||||||||||||||||||||||||||||||||||||||||||||||||||||||||||||||||||||||||||
|
03 May |
Might
there be anything positive to be found in the disaster? A 2009 study
by Jessica Teets in The China Quarterly argues that in the wake of the 2008 Sichuan
earthquake participation in relief efforts strengthened civil society through
increased capacity, publicity and interaction with local government. Perhaps
this is something to think about during the reconstruction process. |
||||||||||||||||||||||||||||||||||||||||||||||||||||||||||||||||||||||||||||||||||||||||||||||||||||||||||||||||||||||||||||||||||||||||||||||||||||||||||||||||||||||||||||||||||||||||||||||||||||||||||||||||||||||||||||||||||||||||||||||||||||||||||||||||||||||||||||||||||||||||||||||||||||||||||||||||||||||||||||||||||||||||||||||||||||||||||||||||||||||||||||||||||
|
02 May |
UN
Situation Report 08 (01 May). |
||||||||||||||||||||||||||||||||||||||||||||||||||||||||||||||||||||||||||||||||||||||||||||||||||||||||||||||||||||||||||||||||||||||||||||||||||||||||||||||||||||||||||||||||||||||||||||||||||||||||||||||||||||||||||||||||||||||||||||||||||||||||||||||||||||||||||||||||||||||||||||||||||||||||||||||||||||||||||||||||||||||||||||||||||||||||||||||||||||||||||||||||||
|
01 May |
In the
years leading up to the quake, the child nutrition profile in Nepal had been
improving steadily. Nevertheless, levels of acute and chronic malnutrition remain
very high in most of the earthquake affected districts (although somewhat
better than in many other parts of the country). The graph below shows
district-average measures of linear growth (height-for-age Z-scores) for
children below the age of 5. According
to the 2011 Nepal census, approximately 700,000 children below the age of 2
live in the earthquake-affected districts. These are the individuals at
greatest risk from food insecurity. In the absence of rapid deployment of
emergency food aid to the affected areas, millions of children will be at
risk and if food insecurity persists, recent gains are likely to be eroded.
The
population of children under age 2 in the affected districts is as follows:
Source: 2011 Nepal
Census |
||||||||||||||||||||||||||||||||||||||||||||||||||||||||||||||||||||||||||||||||||||||||||||||||||||||||||||||||||||||||||||||||||||||||||||||||||||||||||||||||||||||||||||||||||||||||||||||||||||||||||||||||||||||||||||||||||||||||||||||||||||||||||||||||||||||||||||||||||||||||||||||||||||||||||||||||||||||||||||||||||||||||||||||||||||||||||||||||||||||||||||||||||
|
30
April |
UN
Nepal situation report No. 07 (30 April) The
following map clearly shows that, in many cases, because of topography and a
shortage of roads, east-west travel in the hills and mountains is severely
constrained. Furthermore, many locations are simply inaccessible by road, as
the second map shows. Fortunately, many of the most isolated and inaccessible
parts of the country, such as those in the far west, are reported to have had
relatively less earthquake damage than districts around Kathmandu.
Source: Ministry of
Physical Planning and Works, Department of Roads Statistics of Strategic Road Network 2009/10.
|
||||||||||||||||||||||||||||||||||||||||||||||||||||||||||||||||||||||||||||||||||||||||||||||||||||||||||||||||||||||||||||||||||||||||||||||||||||||||||||||||||||||||||||||||||||||||||||||||||||||||||||||||||||||||||||||||||||||||||||||||||||||||||||||||||||||||||||||||||||||||||||||||||||||||||||||||||||||||||||||||||||||||||||||||||||||||||||||||||||||||||||||||||
|
29
April |
UN
Nepal situation report No. 06 (29 April)
Here
is the table again, this time sorted in declining order of district
population:
Recent
media and UN reports suggest 39 affected districts, but the UN map highlights
only 36 districts. It is also being widely reported that approximately 8
million people are affected, and that more than a million require immediate
food assistance. With a
total population of 28 million in the country as a whole, it is reasonable to
expect that roughly half the population has been directly affected by the
quake. Obviously, even those not
directly impacted will be indirectly affected through a range of market and
non-market channels. The
latest media reports suggest massive out-migration – perhaps as many as
100,000 people thus far – from the Kathmandu valley (although to where,
exactly, one has to wonder). Here
is a chart showing population by district for those districts on the list:
And
another specifically for the population of children under age 2:
|
||||||||||||||||||||||||||||||||||||||||||||||||||||||||||||||||||||||||||||||||||||||||||||||||||||||||||||||||||||||||||||||||||||||||||||||||||||||||||||||||||||||||||||||||||||||||||||||||||||||||||||||||||||||||||||||||||||||||||||||||||||||||||||||||||||||||||||||||||||||||||||||||||||||||||||||||||||||||||||||||||||||||||||||||||||||||||||||||||||||||||||||||||
|
28
April |
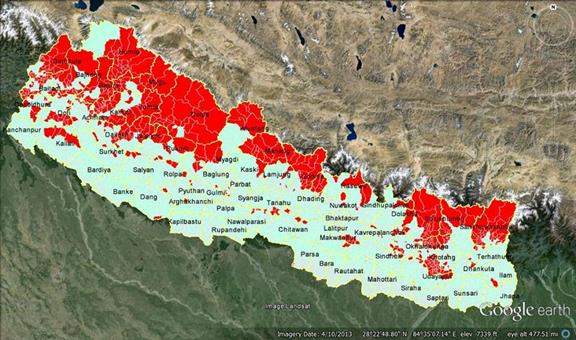
The following map was created by the UN country team in
Nepal and shows the districts affected by the earthquake and estimated likely
severity of damage (source: http://www.un.org.np/,
accessed 28 April 2015).
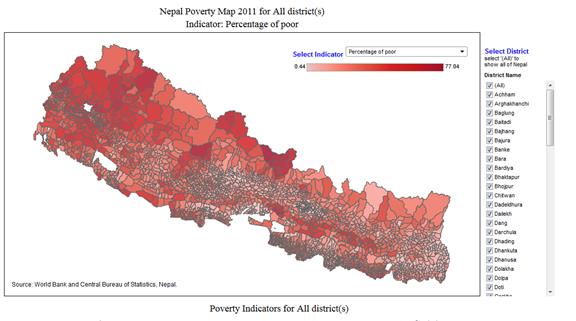
For comparison, here is the 2011 poverty map
of Nepal prepared by the World Bank (source: http://dataviz.worldbank.org/t/SASEP/views/NepalTargetLevelFinal/NepalPovertyMap2011?:embed=y&:display_count=no,
accessed 28 April 2015)
|
||||||||||||||||||||||||||||||||||||||||||||||||||||||||||||||||||||||||||||||||||||||||||||||||||||||||||||||||||||||||||||||||||||||||||||||||||||||||||||||||||||||||||||||||||||||||||||||||||||||||||||||||||||||||||||||||||||||||||||||||||||||||||||||||||||||||||||||||||||||||||||||||||||||||||||||||||||||||||||||||||||||||||||||||||||||||||||||||||||||||||||||||||
|
|
|
||||||||||||||||||||||||||||||||||||||||||||||||||||||||||||||||||||||||||||||||||||||||||||||||||||||||||||||||||||||||||||||||||||||||||||||||||||||||||||||||||||||||||||||||||||||||||||||||||||||||||||||||||||||||||||||||||||||||||||||||||||||||||||||||||||||||||||||||||||||||||||||||||||||||||||||||||||||||||||||||||||||||||||||||||||||||||||||||||||||||||||||||||
|
Nepal
Country Profile: http://www.worldbank.org/en/country/nepal FAO: http://coin.fao.org/cms/world/nepal/Home.html BBC
Asia: http://www.bbc.com/news/world/asia NY Times Asia: http://www.nytimes.com/pages/world/asia/index.html |
|||||||||||||||||||||||||||||||||||||||||||||||||||||||||||||||||||||||||||||||||||||||||||||||||||||||||||||||||||||||||||||||||||||||||||||||||||||||||||||||||||||||||||||||||||||||||||||||||||||||||||||||||||||||||||||||||||||||||||||||||||||||||||||||||||||||||||||||||||||||||||||||||||||||||||||||||||||||||||||||||||||||||||||||||||||||||||||||||||||||||||||||||||
|
27 April |
|||||||||||||||||||||||||||||||||||||||||||||||||||||||||||||||||||||||||||||||||||||||||||||||||||||||||||||||||||||||||||||||||||||||||||||||||||||||||||||||||||||||||||||||||||||||||||||||||||||||||||||||||||||||||||||||||||||||||||||||||||||||||||||||||||||||||||||||||||||||||||||||||||||||||||||||||||||||||||||||||||||||||||||||||||||||||||||||||||||||||||||||||||
|
26 April |
UN
Nepal situation report No. 03 (26 April) |
||||||||||||||||||||||||||||||||||||||||||||||||||||||||||||||||||||||||||||||||||||||||||||||||||||||||||||||||||||||||||||||||||||||||||||||||||||||||||||||||||||||||||||||||||||||||||||||||||||||||||||||||||||||||||||||||||||||||||||||||||||||||||||||||||||||||||||||||||||||||||||||||||||||||||||||||||||||||||||||||||||||||||||||||||||||||||||||||||||||||||||||||||
|
25 April |
UN
Nepal situation report No. 01 (25 April) |