Slide 20 of 24
Notes:
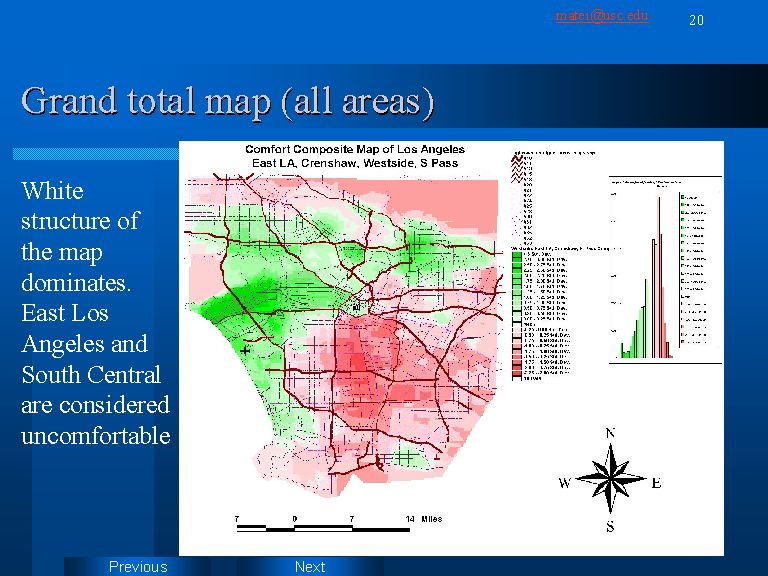
Slide 20 presents the final, four map area of Los Angeles. It is easy to see that in its broad contours it resembles the map of the White participants. Also, the chart shows a pronounced right (negative values) skew. Based on this map we can say that people in Los Angeles feel less than comfortable in more than 50% of the areas of the city.