 PLOTTING
EARTHQUAKE EPICENTERS
PLOTTING
EARTHQUAKE EPICENTERS
L.W. BraileÓ and S.J. Braile
http://web.ics.purdue.edu/~braile
(January,
2001)
![]()
Objective:
Create a plot of worldwide earthquake epicenters to display the narrow zones of seismic activity of the Earth and aid in an understanding of plate tectonics. About 95% of earthquakes occur along plate boundaries where the lithospheric plates (about 100 km thick shell of relatively cool, rigid and brittle rock overlying the softer, hotter asthenosphere zone within the Earth’s upper mantle) move with respect to each other in three ways - diverging or moving apart (such as at the mid-ocean ridges), converging or colliding (such as along the west coast of South America, the Aleutian Islands, or the western Pacific) and transform or horizontal slipping (such as along the San Andreas fault in California). It is useful to initially perform the epicenter plotting activity "by hand." The experience allows the student to fully understand the characteristics of the data, learn how to obtain real and timely earthquake data from the Internet, and practice map skills, including longitude and latitude, directions, two-dimensional interpolation, and basic world geography. Extensions to this activity are described that include producing maps with computer software or from the Internet.
Two options for plotting earthquake epicenters are provided. In Option 1, a list of recent epicenters is used and students may plot the epicenters on a small map of the world during one or two class periods. The list contains a sufficient number and distribution of earthquakes so that the characteristic global pattern of seismicity associated with plate tectonics can be seen. For Option 2, a several-month (semester or academic year) activity is described in which students periodically (such as every few days, every week or every two weeks) obtain information on the earthquakes that have occurred in the last few days or weeks. These data are easily available on the Internet. The near-real-time nature of the data (as the project develops, the students will obtain data on several earthquakes that they have heard about in the news) and the progression through time, in which, because of the student’s regular efforts at data collection and plotting, global seismicity patterns will slowly become visible on the map posted on the wall in the classroom, stimulate interest in seismic activity and the mapping of global earthquakes.
Materials:
Option #1 (for each student) - Small map and earthquake list
- Photocopy of map of the world with latitude and longitude lines (attached, Figure 4; from Seismic Sleuths, pages 211-212).
- List of one-year of global seismicity, magnitude greater than or equal to 6.0 (Figure 5).
- Pencil (three colored pencils, optional).
Option #2 - Large wall map for classroom, earthquake data downloaded periodically from the Internet
- One colored map of the world with latitude and longitude lines; a wall map of about 1:40 million scale will work well; an excellent map for this purpose can be obtained from office supply stores for about $5.00 (the world map, 127x97 cm, from the American Map Corporation, available at Staples, is a good choice because it has latitude and longitude labels that are easy to read and is centered on 90°W longitude, North America, resulting in the Pacific Ocean area, where many earthquakes occur, being shown completely on one side of the map; the map also does not repeat regions on both sides of the map which can be confusing for plotting the epicenters). Because these maps often have very small labels to identify the longitude and latitude lines, it is useful to use a felt pen to write larger longitude and latitude labels on the map. The lines for the equator (0° latitude), prime meridian (0° longitude), and 180° longitude (which separates eastern and western longitudes in the western Pacific Ocean area) can also be marked by drawing a thicker line over the existing lines to make it easier for students to find locations on the map.
- Earthquake data; lists of earthquake data can be downloaded from the Internet from http://www.iris.edu, (example of Internet download and resulting lists are shown below. Earthquake data can also be obtained from the USGS search site: http://neic.usgs.gov/neis/epic/epic.html.
- Colored, self adhesive dots; four packages of multicolored (red, yellow, green, blue) dots in three sizes (Avery labels, #05795, ¼”; #05764, ½”; #05472, ¾”; ¼, ½ and ¾ inch diameter; because there will be more small earthquakes, you will need two packages of the ¼” dot size and one package each of the ½” and ¾” size; each package contains 4 colors of dots.
Procedure:
Plotting the earthquake epicenters for either option requires locating specific points (epicenters) on the map using the coordinates (longitude and latitude). In order to locate and plot these points accurately, students must understand the Earth’s geographic coordinate system represented by longitude and latitude, and two-dimensional interpolation so that epicenters that do not occur exactly along the lines of longitude and latitude that are provided on the map, may be plotted. Brief descriptions of longitude and latitude and two-dimensional interpolation are provided below.
Longitude and Latitude
The
surface of the globe is divided into lines of longitude and latitude defining
360°
of angle (and therefore location) in an east-west direction (lines of
longitude) and 180°
of angle in a north-south direction.
Using these definitions of longitude and latitude, any position on the
Earth can be delineated by a unique pair of coordinates. Lines of longitude and latitude for the Earth
are shown in Figure 1. The lines of
longitude extend from pole to pole and are labeled from 0° to
360°. These lines are called “meridians” and they
define the directions north (toward the North Pole) and south (toward the South
Pole). Maps are commonly displayed with
north to the top of the map. The meridian
at 0°
(through
Lines
of latitude are also called parallels because they are always parallel to each
other. The lines of latitude define east
and west directions (parallel to or along the lines of latitude). Zero degrees latitude is the equator (half
way between the South and North Poles), and lines of latitude increase to the
north away from the equator and are labeled North (or positive) latitudes and
increase to the south away from the equator and are labeled South (or negative)
latitudes. Using this system, the two
coordinates (longitude and latitude can easily be used to identify a specific
location. For example, the coordinates
71°W
longitude and 20°S
latitude define a location just off the coast (in the Pacific Ocean) of South
America near northern
Because of different map projections, the lines of longitude and latitude may or may not be straight lines on a map. Additional information about longitude and latitude, maps and map projections can be found in almost any atlas or geography book.
Two-Dimensional Interpolation
Two-dimensional (2-D) interpolation is a method of calculating or estimating the location of a specific two-dimensional (2 coordinate, or x-y, or longitude-latitude) pair of coordinates based on known, surrounding positions of a grid of locations, usually defined by a few evenly-spaced values of x-y or longitude-latitude lines. On a typical map, lines of longitude and latitude form a grid of locations surrounding any arbitrary position on the map. To estimate the position of a specific point given the longitude and latitude coordinates, one must first find the rectangle of longitude and latitude grid lines which surround the value. For example, for the point defined by coordinates 71°W longitude and 20°S latitude, the rectangle shown in Figure 3 can be found. In this example, the lines of longitude and latitude are provided at every 15 degrees. On other maps, a different interval may be present. Once the appropriate rectangle or grid cell is identified, the exact location of the point is found by dividing the boundaries of the grid cell into even intervals. Tic marks may be used to identify the intervals. Finally, the location of the point may be plotted as shown in Figure 3. After developing experience with plotting points using 2-D interpolation, accurate estimates can be made without adding the tic marks or drawing the dashed lines shown in Figure 3.
Note that in some cases, because of different map projections, the lines of longitude and latitude which define the grid cells may not be straight or define a rectangle. The 2-D interpolation can still be used in these cases as long as appropriately-curved, dashed lines (similar in shape to the grid cell lines) are used to find the point of intersection. Also note that, as in the case illustrated in Figure 3, the lines of longitude and latitude may not increase to the right and upward as one most-commonly finds with x-y coordinate systems. For example, for the western half of the southern hemisphere (as in Figure 3), west longitude increases to the left and south latitude increases downward. Initially, labeling the longitude and latitude lines, tic marks and lines of intersection (dashed lines), as shown in Figure 3, will lead to accurate 2-D interpolation and promote understanding of the method.
Option 1 - Small Maps and One Year Earthquake List
Provide each student with an 11x17 inch copy of the attached world map (assemble from the two halves shown in Figure 4) and a copy of an earthquake list (the simplified list, Figure 5 is easy to use; you can generate other earthquake lists using the Internet sites and instructions described in Option 2). Using the longitude, latitude and magnitude of each earthquake, plot the epicenter on the map. Because of the scale of the map, it will be sufficiently accurate to round-off the longitude and latitude values to the nearest degree. Plot the epicenter at longitude-latitude coordinates using a small dot (·). Use a dot of about 1mm in diameter for earthquake magnitude 6.0-6.9; a larger dot (about 3mm in diameter for earthquakes of magnitude 7.0-7.9; and a large dot (about 1 cm in diameter) for earthquakes of magnitude 8.0 or greater. As an option, additional information can be portrayed on the map by color coding the depths of each earthquake. If you choose this option, use three colored pencils - red, green and blue. Plot all shallow earthquakes (less than 70 km depth) with red dots, all intermediate depth earthquakes (70 to 300 km depth) green, and all deep focus earthquakes (depths greater than 300 km) blue. Continue to use different sized dots for the different magnitude ranges as well.
The earthquake list (Figure 5) contains earthquakes of magnitude greater than or equal to 6.0 that occurred worldwide during the calendar year 2000 (176 events). Notice that there are far fewer magnitude 7.0-7.9 earthquakes (medium sized dots) than magnitude 6.0-.6.9 earthquakes (small dots) and only one earthquake of magnitude 8.0 or greater (large dot). This distribution of magnitudes for the 2000 earthquakes is consistent with worldwide earthquake statistics that have been tabulated for many decades as illustrated in Table 1 below from the USGS (United States Geological Survey):
Table 1. Frequency of Occurrence of Global Earthquakes
Based on Observations Since 1900
|
|
Descriptor |
Magnitude |
Average Number Annually |
|
|
Great |
8 and higher |
1 |
|
|
Major |
7 - 7.9 |
18 |
|
|
Strong |
6 - 6.9 |
120 |
|
|
Moderate |
5 - 5.9 |
800 |
|
|
Light |
4 - 4.9 |
6,200 (estimated) |
|
|
Minor |
3 - 3.9 |
49,000 (estimated) |
|
|
Very Minor |
< 3.0 |
Mag. 2 - 3: about 1,000/day Mag. 1 - 2: about 8,000/day |
Although we have only plotted a relatively small number of earthquakes (only one year’s events and only earthquakes of magnitude of 6.0 or greater) on the map, the characteristic distribution of earthquake epicenters is visible. The vast majority of earthquakes occur along narrow zones associated with plate boundaries. If you have used the color coding of dots according to depth of the earthquake, notice that earthquakes along the mid-ocean ridges and along transform fault zones are always shallow and earthquakes within convergent plate boundary zones have shallow, intermediate and deep focus events corresponding to a dipping slab of lithosphere.
Additional information about the global distribution of earthquakes and the relationship to plate boundaries and plate tectonics can be found in Bolt (1993), This Dynamic Earth, or the map, This Dynamic Planet, (Simkin et al., 1994). The Simkin et al. map is also an excellent resource for comparing the hand plotted epicenter maps with a more complete display of global seismicity. Note the association of epicenters with various topographic features of the continents and oceans (mid-ocean ridges, trenches, fracture zones, mountain ranges) and the pattern of shallow, intermediate and deep focus earthquakes along convergent zones. The earthquakes delineate a dipping slab of events defining a subduction zone. An excellent Internet site for viewing ocean basin topography (bathymetry) is: http://www.ngdc.noaa.gov/mgg/global/. An additional resource for exploring earthquakes and plate tectonics is the CD-ROM, “Plate Tectonics”, by TASA.
To view computer plots of seismicity, one can access the Internet at the following locations:
Seismic Monitor (http://www.iris.edu) which displays current global earthquake activity.
Pre-assembled Event Maps (go to www.iris.edu, click on the "E and O Home Page", then on "Educators," then look for "Event Search" where you can request "pre-assembled maps" or "create your own") are available from the IRIS Data Management Center site. These maps display recent seismicity and are updated regularly so that up-to-date information is displayed. One can also make your own map by selecting a specific area and time period of earthquake data to display. More information is included in Option 2.
USGS/NEIC earthquake maps which allow you to view seismicity maps of the world or of various regions. Information on ordering seismicity maps can be found at: [http://neic.usgs.gov/products_and_services.html] or view regional maps on the Internet at: [http://neic.usgs.gov/neis/general/handouts/general_seismicity.html].
SeisVolE (http://bingweb.binghamton.edu/~ajones/) is a computer program which can be downloaded and operated on your computer (Windows 95/98) to plot recent historic earthquake epicenters for the world or using regional and local views.
Option 2 - Large Wall Map in Classroom, Regular Internet Search to Obtain Earthquake Data
In this option, students gather and plot earthquake data on a regular basis throughout the academic year (or semester). This option provides for a more constructivist or inquiry-based approach in which students collect data, observe and analyze the patterns of earthquakes which progressively appear on the map, and begin to ask questions about the data and interpretations. The teacher may defer the questions until later, provide some information toward answering their questions, or challenge the students to think and analyze for themselves (for example, ask what other features or characteristics of the Earth are correlative with the pattern of earthquake epicenters that appears on the map?) and search out additional information from materials available in the classroom or library or from the Internet. No matter how the teacher handles these questions, the objective is to stimulate interest in the earthquake plotting process and promote critical thinking and questions in the students. As the plotting activity progresses, the epicenters will display the characteristic pattern of earthquakes that is consistent with plate tectonics. An additional advantage of this option is that students gain practice with using the computer and the Internet. The activity should be initiated early in the academic year, long before lessons on Earth structure, rocks or plate tectonics are covered. Only a small amount of time (the equivalent of a few minutes a day) need be devoted to the Internet search to obtain earthquake data and plot the epicenters on the wall map.
A convenient and effective method is to download and plot the most recent earthquake data every one to two weeks (Figure 7). A group of two to three students can be assigned this task for two or three repetitions and then the job can be rotated to another group. The previous group may help train the new group in the necessary map skills (longitude and latitude, 2-D interpolation, using the legend, etc.) and in the computer data access procedure. As the pattern of epicenters emerges and as significant earthquakes occur that the students hear about in the news (the teacher may wish to bring newspaper clippings or obtain information from the Internet about specific events) and plot on their class’ map, student interest in earthquakes, the causes of earthquakes, and earthquake hazards will increase. The students are using real data and studying earthquakes from all over the world that have occurred only a few days or even hours ago.
To obtain the earthquake information (an example for the year 2000 is shown in Figure 6) for the last few days or weeks (or for any time period after November, 1989), go to the Internet site http://www.iris.edu. (IRIS, Incorporated Research Institutions for Seismology, is a consortium of over 90 research institutions with major commitments to research and education in seismology and related fields. IRIS operates a facilities program in observational seismology and data management sponsored by the National Science Foundation through its Division of Earth Sciences.) Click on the Education and Outreach “Home page”, and then on the “educator” link. From the list of options, select the “Event Search, Create your own” link. You will see displayed an earthquake event search form, which looks like the one shown in Figure 8. Fill out the form in a similar manner to that shown in Figure 8. Any dates and times can be used, but be sure to cover the time period since your most recent search (so that all earthquakes are included in your data and on the plot) if this is not your first event search. It is convenient to just enter six zeros in the time boxes. Note for the search shown in Figure 8, we are requesting earthquakes that occurred in the time period beginning January 1, 2001 through January 26, 2001. The times used in the event search are UTC (Coordinated Universal Time, also known as GMT or Greenwich Mean Time; UTC time is five hours later than Eastern Standard Time). Enter the magnitude range 5.0 to 10.0. Using earthquakes of magnitude greater than or equal to 5.0 will provide a sufficient number of events (about 80 per month) for plotting, and will include the best-known and best-located events and nearly all significant events (which are usually those of larger magnitude) during the selected time period. The maximum magnitude entry box is normally set to 10.0 (although it can be changed) even though there is no “maximum” to the magnitude scale. Magnitude is a measure of the amount of energy or “size” of an earthquake and can be nearly any number, including negative numbers (which are very small earthquakes, but because of the definition of magnitude, are not “negative energy” events) or, theoretically, numbers greater than 10. However, earthquakes of magnitude greater than 8 are very rare (about one per year worldwide) and the largest known earthquakes had magnitudes of about 9.5. (See “Extensions …” section, below, for sources of information on earthquake magnitude.)
Leave the “Radius” and “Depth Min” and “Depth Max” data entry boxes at their default values of 0, 0 and 1000, respectively, to obtain earthquakes at all depths (virtually all known earthquakes occur shallower than about 700 km depth). For a worldwide search, use the default values of latitude (-90 to 90) and longitude (-180 to 180) to obtain events for the entire world. Notice that south latitude is designated by a negative number and west longitude is also given by a negative number. For restricted area searches, these latitude and longitude limits can be changed. Leave the “Output options” and “Map options” in their default selections (“Send output to screen”, and “None (view as text)”, respectively) and click on “Submit Search”. The requested earthquake data will be displayed (normally, in just a few seconds) on your screen, and the output may be printed to provide a convenient list for performing the plotting on the wall map. An example of the earthquake list for the input data shown in Figure 8 is given in Figure 9. If you have made a mistake and the list does not include the data that you wanted, go back to the event search form (click on “Back” on your browser) and correct the data entry.
One can also perform an event search using the USGS site at: http://neic.usgs.gov/neis/epic/epic.html.
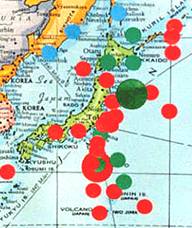
When the earthquake data list for a given time period has been printed, locate each event on the map by longitude and latitude. Because of the scale of the map, a location accuracy of one degree will be sufficient, so you may round off the longitude and latitude values to the nearest degree. To plot the epicenter, select the appropriate adhesive dot using the legend given in Figure 10. A color copy of Figure 10 can be attached to the world map to provide a legend for the earthquake data that are displayed on the map. The dot size is chosen according to the magnitude of the earthquake (small dots, ¼” diameter, are used for magnitudes 5.0-5.9; medium dots, ½” diameter, are used for magnitudes 6.0-6.9; and large dots, ¾” diameter, are used for earthquakes of magnitude 7.0 or greater). The depth of the earthquake is indicated by color of the dot - red for shallow, green for intermediate and blue for deep. An example of a map with some earthquake epicenters plotted with colored dots is shown in Figure 11.
After a few months of gathering the earthquake data from the Internet and plotting the epicenters on the classroom wall map, discuss the patterns evident in the distribution of earthquakes and introduce the concept of plate tectonics and other Earth science topics. Comparison of the student-generated map with the This Dynamic Planet map (Simkin et al., 1994) will verify the patterns developed on the students’ map and allow additional correlations and analysis because of the more complete earthquake data and topographic information which are displayed on the Simkin et al. map. A small map showing global seismicity is given in Figure 12 and a map of plates is given in Figures 13 and 14. Additional resources and ideas for lessons are described in the Option 1 discussion and in the “Extensions” section below.
Extensions, Connections and Enrichment:
Additional opportunities for learning associated with the epicenter plotting activity are listed below. These activities can be additional class lessons or individual student enrichment activities. Additional materials for teaching about earthquakes are listed in “SEISMOLOGY--Resources for Teachers”, available on the Internet at: http://web.ics.purdue.edu/~braile/edumod/seisres/seisresweb.htm.
1. Earthquake activity can be easily tied to geography knowledge, including map skills and practice, and recognition of locations and countries around the globe. The “Location” information on the earthquake lists from the Internet Event Search will provide prompts to many interesting locations (for example: Loyalty Islands; Dodecanese Islands; Oaxaca, Mexico; Sunda Strait; Azerbaijan; Kuril Islands; Banda Sea; Lake Tanganyika; Vanuatu Islands; Southern Sumatera; etc.).
2. Earth’s Interior Structure - The seismic waves which propagate through the Earth and are recorded at seismograph stations also provide information on the structure of the Earth’s interior. Activities related to Earth structure include the activities "Earth’s Interior Structure" and "3-D Model of the Earth’s Interior." Additional information may be found in Bolt (1993).
3. Significant Earthquake - When a
significant event (usually a large earthquake that causes damage or an event in
an unusual location, or one very near to your location) occurs somewhere in the
world, you may wish to use media reports or information available on the
Internet to explore various aspects of the earthquake or its effects. These events are particularly useful for
stimulating a discussion about earthquake hazards. For
4. Earthquake Magnitude - For additional information on measuring the size of earthquakes and the different magnitude scales, see: Bolt (1993 and 1999), Jones (1995), dePolo and Slemmons (1990), Johnston (1990), Monastersky (1994) or the Internet sites:
http://pubs.usgs.gov/gip/earthq4/severitygip.html
http://www.seismo.berkeley.edu/seismo/faq/magnitude.html
http://neic.usgs.gov/neis/general/handouts/general_seismicity.html
http://www.seismo.unr.edu/ftp/pub/louie/class/100/magnitude.html
http://lasker.Princeton.edu/ScienceProjects/curr/eqmag/eqmag.htm
http://www.eas.slu.edu/People/CJAmmon/HTML/Classes/IntroQuakes/Notes/earthquake_size.html
5. Earthquake Location Methods - To explore one of the methods by which earthquake epicenters (and, sometimes, depths) are determined from seismograms, see Bolt (1993), the "Walk-Run, S-P Time Simulation," or the Internet sites: http://quake.wr.usgs.gov/info/eqlocation/index.html; Virtual Earthquake, http://vcourseware3.calstatela.edu/.
6. To view additional plots of earthquake locations, see http://neic.usgs.gov/neis/general/handouts/general_seismicity.html, or download the SeisVolE software from http://www.geol.binghamton.edu/faculty/jones/ and plot your own maps using this powerful, versatile and easy-to-use program, or click on “pre-assembled maps” in the Event Search page from the IRIS web site.
7. To view seismic data (seismograms) on the Internet, try these sites:
WILBER (through the IRIS web site: http://www.iris.edu)
QuakeView, MichSeis (http://geo.lsa.umich.edu/MichSeis)
Live Internet Seismic Server (LISS) through the Albuquerque Seismological Laboratory (ASL) of the U.S. Geological Survey (http://aslwww.cr.usgs.gov) for near real time data
Southern
Princeton Earth Physics Project (PEPP; http://lasker.princeton.edu/index.shtml)
COSMOS Virtual Data Center for strong motion accelerograms (seismograms recorded with instruments that have a response that is approximately proportional to acceleration) are available for viewing or download (http://db.cosmos-eq.org/; click on "Earthquakes," then select an event of interest and click on it, such as the Loma Prieta, CA earthquake under the Northern California listing, then select a station and click on "ViewPlot of Data")
8. Explore wave propagation - Use a slinky and the “human wave” activities (see "Seismic Waves and the Slinky") to demonstrate the propagation of P (compressional) and S (shear) waves. Also, an excellent computer program, Seismic Waves, can be used to view wave propagation through the Earth and resulting surface seismograms. The program is available to download from http://www.geol.binghamton.edu/faculty/jones
9. Investigate plate tectonics - See “This Dynamic Earth: The Story of Plate Tectonics,” Bolt (1993), Ernst (1990), the lesson plan “Voyage Through Time,” TASA CD-Rom “Plate Tectonics,” or the "Continental Drift and Plate Tectonics" video.
10. Explore the seismicity of a specific area - You
may choose a local area or region to study using earthquake epicenters (
11. Explore the depth
distribution of earthquakes in a subduction zone. Select a convergent plate tectonic boundary,
such as the Aleutians, western South America (
REFERENCES
Bolt, B.A., Earthquakes
and Geological Discovery, Scientific American Library, W.H.
Bolt, B.A., Earthquakes,
(4rd edition), W.H. Freeman & Company,
DePolo, C.M., and D.B. Slemmons, Estimation of earthquake size for seismic hazards, in Neotectonics in Earthquake Evaluation (edited by E.L. Krinitzsky and D.B. Slemmons), Geol. Soc. Amer., Rev. Eng. Geol., VIII, 1-28, 1990.
Ernst, W.G., The
Dynamic Planet,
FEMA/AGU, Seismic
Sleuths - Earthquakes - A Teachers Package on Earthquakes for Grades 7-12,
American Geophysical Union, Washington, D.C., 367 pp., 1994. (FEMA 253, for free copy, write on school
letterhead to: FEMA,
Jones, L.M., Putting
Down Roots in Earthquake Country,
Monastersky, R., Abandoning Richter, Science News, v. 146, p. 250-252, October 15, 1994.
Simkin, T., J.D. Unger, R.I. Tilling, P.R. Vogt, and H. Spall, This Dynamic Planet – World Map of Volcanoes, Earthquakes, Impact Craters, and Plate Tectonics, Map, 1:30,000,000, Smithsonian Institution and U.S. Geological Survey, 1994. (Available from the U.S. Geological Survey, Box 25286, Denver, CO 80225, (303) 292-493, (Fax) or (888) ASK-USGS, $7 + $5 shipping, http://pubs.usgs.gov/pdf/planet.html).
TASA Plate Tectonics CD-Rom - Plate tectonics, earthquakes, faults, ($59 or $155 for site license), (800-293-2725) http://www.tasagraphicarts.com, Mac or Windows.
U.S. Geological Survey, This Dynamic Earth: The Story of Plate Tectonics, available from: U.S. Geological Survey, Map Distribution, Federal Center, PO Box 25286, Denver, CO 80225, $6, (800 USA MAPS). Also available (full text and figures) for viewing at: http://pubs.usgs.gov/publications/text/dynamic.html.
Figure 1. Map
of the world showing longitudes and latitudes.
Figure 2. Conventions for latitude and longitude labeling for the Earth for three different systems. In all cases, 0° latitude is the equator (halfway between the North and South Poles) and 0° longitude is the Prime Meridian (through Greenwich, England). For system C, the longitude may begin on the left with 0° so that the Eastern Hemisphere is plotted on the left side of the map and the longitudes go from 0° to 360° (example: http://web.ics.purdue.edu/~braile/eas100/OceanAge.pdf).
Figure 3. Two-dimensional interpolation to find the position of the point 71°W longitude and 20°S latitude. The heavy lines are the lines of longitude and latitude on the map. The light tic marks and small numbers are interpolated longitudes and latitudes determined by evenly dividing the horizontal and vertical lines into intervals. The exact coordinates may then be located within the rectangle (longitude-latitude grid) by drawing the dashed lines, which intersect at the given coordinates.
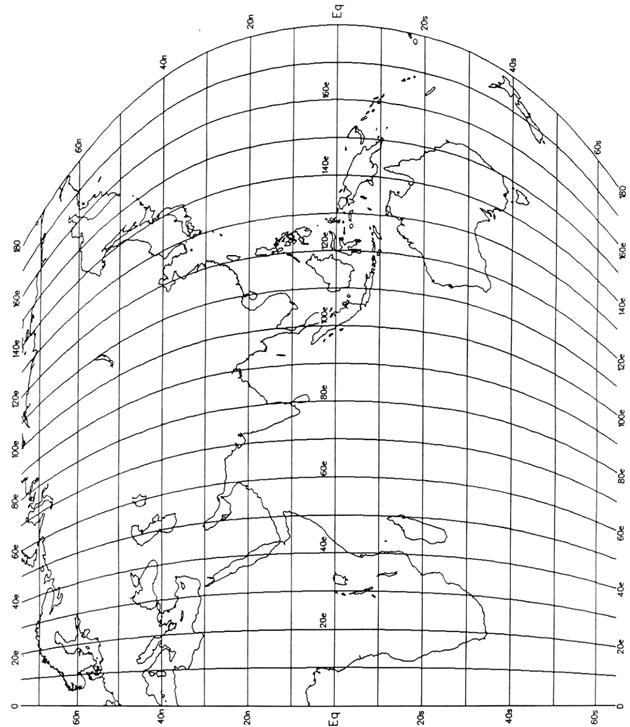
Figure 4. World map for plotting epicenters (from “Seismic Sleuths”, pages 211-212).
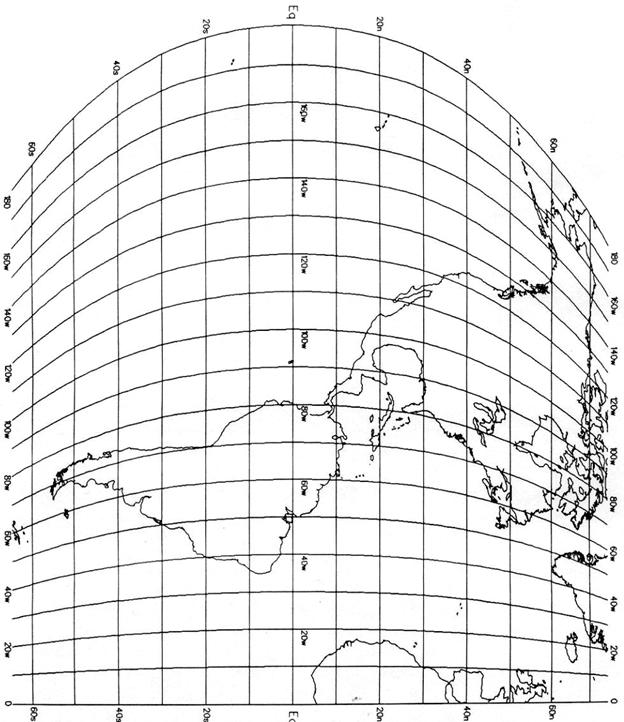
Fig. 4 (cont.)
Figure 5. Simplified list of the year 2000 earthquakes. The columns on this simplified list are: Number (a sequential number to make it easier to refer to specific events); Date; Latitude (rounded to the nearest degree); Longitude (rounded to the nearest degree); Depth (km); Magnitude; Location. Multiple listings of the same event have been eliminated. Because moment magnitude (Mw) is the most reliable magnitude estimate, the moment magnitude data were selected for those events that had multiple magnitude determinations. More information on the readings is provided in the caption for Figure 6.
Number |
Date (Mo:Da:Yr) |
Lat. (- = S) |
Long. (- = W) |
Depth (km) |
Magn. |
Location |
|
1 |
12/28/00 |
-4 |
152 |
33 |
6.2 |
|
|
2 |
12/23/00 |
-8 |
136 |
61 |
6.0 |
|
|
3 |
12/22/00 |
45 |
147 |
137 |
6.2 |
|
|
4 |
12/21/00 |
-5 |
154 |
386 |
6.0 |
|
|
5 |
12/21/00 |
-6 |
151 |
33 |
6.5 |
|
|
6 |
12/20/00 |
-9 |
154 |
33 |
6.6 |
DENTRECASTEAUX
|
|
7 |
12/20/00 |
-39 |
-74 |
33 |
6.4 |
OFF COAST
OF |
|
8 |
12/19/00 |
12 |
145 |
33 |
6.3 |
SOUTH OF |
|
9 |
12/18/00 |
-21 |
-179 |
600 |
6.6 |
|
|
10 |
12/15/00 |
39 |
31 |
10 |
6.1 |
|
|
11 |
12/12/00 |
6 |
-83 |
10 |
6.1 |
SOUTH OF |
|
12 |
12/6/00 |
-4 |
153 |
31 |
6.6 |
|
|
13 |
12/6/00 |
40 |
55 |
30 |
7.5 |
TURKMEN SSR |
|
14 |
12/4/00 |
15 |
-94 |
33 |
6.0 |
NEAR COAST
OF |
|
15 |
12/4/00 |
15 |
-94 |
33 |
6.2 |
NEAR COAST
OF |
|
16 |
11/29/00 |
64 |
-150 |
10 |
6.0 |
|
|
17 |
11/29/00 |
-25 |
-71 |
58 |
6.4 |
NEAR COAST
OF NORTHERN CHI |
|
18 |
11/25/00 |
40 |
50 |
10 |
6.3 |
|
|
19 |
11/25/00 |
40 |
50 |
10 |
6.3 |
|
|
20 |
11/23/00 |
-5 |
153 |
33 |
6.4 |
|
|
21 |
11/21/00 |
-5 |
153 |
33 |
6.2 |
|
|
22 |
11/21/00 |
-5 |
152 |
33 |
6.2 |
|
|
23 |
11/21/00 |
-5 |
153 |
33 |
6.1 |
|
|
24 |
11/19/00 |
-5 |
153 |
33 |
6.0 |
|
|
25 |
11/19/00 |
-6 |
152 |
33 |
6.1 |
|
|
26 |
11/19/00 |
-5 |
152 |
54 |
6.0 |
|
|
27 |
11/18/00 |
-5 |
153 |
33 |
6.0 |
|
|
28 |
11/18/00 |
-5 |
152 |
33 |
6.8 |
|
|
29 |
11/18/00 |
-5 |
153 |
33 |
6.9 |
|
|
30 |
11/17/00 |
-5 |
152 |
33 |
7.6 |
|
|
31 |
11/16/00 |
-5 |
153 |
33 |
6.2 |
|
|
32 |
11/16/00 |
-5 |
153 |
33 |
7.2 |
|
|
33 |
11/16/00 |
-5 |
153 |
30 |
7.6 |
|
|
34 |
11/16/00 |
-5 |
153 |
33 |
6.0 |
|
|
35 |
11/16/00 |
-4 |
152 |
33 |
8.0 |
|
|
36 |
11/13/00 |
42 |
145 |
33 |
6.0 |
|
|
37 |
11/8/00 |
7 |
-78 |
17 |
6.5 |
PANAMA-COLOMBIA
BORDER REG |
|
38 |
11/7/00 |
-6 |
152 |
33 |
6.0 |
|
|
39 |
11/7/00 |
-56 |
-30 |
10 |
6.8 |
|
|
40 |
11/6/00 |
56 |
-153 |
20 |
6.0 |
|
|
41 |
11/1/00 |
-45 |
167 |
24.5 |
6.2 |
|
|
42 |
10/31/00 |
-18 |
-175 |
33 |
6.1 |
|
|
43 |
10/30/00 |
-10 |
119 |
33 |
6.0 |
SUMBA |
|
44 |
10/29/00 |
-5 |
154 |
50 |
6.9 |
|
|
45 |
10/27/00 |
26 |
140 |
388 |
6.1 |
|
|
46 |
10/25/00 |
-35 |
-109 |
10 |
6.1 |
|
|
47 |
10/25/00 |
-7 |
106 |
38 |
6.8 |
|
|
48 |
10/25/00 |
-35 |
-110 |
10 |
6.0 |
|
|
49 |
10/21/00 |
2 |
-91 |
10 |
6.0 |
|
|
50 |
10/21/00 |
-47 |
-12 |
10 |
6.0 |
SOUTH ATLANTIC
RIDGE |
|
51 |
10/6/00 |
35 |
133 |
10 |
6.7 |
SOUTHERN |
|
52 |
10/5/00 |
7 |
127 |
87.3 |
6.0 |
|
|
53 |
10/5/00 |
32 |
-41 |
10 |
6.0 |
NORTH
ATLANTIC RIDGE |
|
54 |
10/4/00 |
-15 |
167 |
23 |
6.8 |
|
|
55 |
10/4/00 |
11 |
-63 |
110 |
6.1 |
|
|
56 |
10/3/00 |
40 |
143 |
33 |
6.1 |
OFF |
|
57 |
10/2/00 |
-8 |
31 |
34 |
6.5 |
|
|
58 |
9/28/00 |
0 |
-81 |
22.9 |
6.6 |
NEAR COAST
OF |
|
59 |
9/26/00 |
-17 |
-174 |
56 |
6.4 |
|
|
60 |
9/22/00 |
-5 |
102 |
33 |
6.2 |
|
|
61 |
9/14/00 |
-16 |
180 |
33 |
6.3 |
|
|
62 |
9/12/00 |
-5 |
102 |
33 |
6.0 |
|
|
63 |
9/12/00 |
35 |
99 |
10 |
6.1 |
|
|
64 |
9/11/00 |
-16 |
-174 |
115 |
6.3 |
|
|
65 |
9/10/00 |
-1 |
129 |
33 |
6.1 |
|
|
66 |
9/2/00 |
-20 |
-179 |
688 |
6.0 |
|
|
67 |
9/1/00 |
1 |
97 |
33 |
6.2 |
OFF W COAST
OF |
|
68 |
8/28/00 |
-4 |
127 |
33 |
6.4 |
|
|
69 |
8/28/00 |
-4 |
127 |
33 |
6.0 |
|
|
70 |
8/28/00 |
-4 |
127 |
10 |
6.1 |
|
|
71 |
8/28/00 |
-4 |
127 |
16 |
6.8 |
|
|
72 |
8/24/00 |
-6 |
103 |
33 |
6.0 |
|
|
73 |
8/21/00 |
-53 |
-46 |
10 |
6.1 |
|
|
74 |
8/19/00 |
44 |
147 |
62.4 |
6.0 |
|
|
75 |
8/15/00 |
-32 |
180 |
358 |
6.6 |
KERMADEC |
|
76 |
8/14/00 |
-9 |
154 |
10 |
6.0 |
DENTRECASTEAUX
|
|
77 |
8/14/00 |
-9 |
154 |
10 |
6.0 |
DENTRECASTEAUX
|
|
78 |
8/12/00 |
-3 |
136 |
33 |
6.0 |
|
|
79 |
8/9/00 |
-17 |
174 |
33 |
6.4 |
|
|
80 |
8/9/00 |
18 |
-102 |
45.8 |
6.5 |
|
|
81 |
8/9/00 |
-16 |
168 |
33 |
6.4 |
|
|
82 |
8/7/00 |
-7 |
123 |
649 |
6.5 |
|
|
83 |
8/6/00 |
29 |
140 |
395 |
7.3 |
|
|
84 |
8/4/00 |
49 |
142 |
10 |
6.8 |
|
|
85 |
8/3/00 |
-12 |
166 |
33 |
6.7 |
|
|
86 |
7/31/00 |
-29 |
-176 |
10 |
6.1 |
KERMADEC |
|
87 |
7/31/00 |
-17 |
175 |
10 |
6.1 |
|
|
88 |
7/30/00 |
34 |
139 |
10 |
6.5 |
SOUTH |
|
89 |
7/21/00 |
9 |
-85 |
33 |
6.4 |
OFF COAST
OF |
|
90 |
7/20/00 |
37 |
141 |
47.1 |
6.0 |
NEAR EAST
COAST OHONSHU, |
|
91 |
7/17/00 |
36 |
71 |
141 |
6.4 |
|
|
92 |
7/16/00 |
-12 |
167 |
33 |
6.1 |
|
|
93 |
7/16/00 |
-8 |
151 |
10 |
6.6 |
|
|
94 |
7/16/00 |
20 |
122 |
33 |
6.4 |
PHILIPPINE |
|
95 |
7/15/00 |
34 |
139 |
10 |
6.1 |
NEAR S.
COAST OHONSHU, J |
|
96 |
7/11/00 |
57 |
-154 |
43.6 |
6.8 |
|
|
97 |
7/10/00 |
47 |
145 |
360 |
6.1 |
|
|
98 |
7/8/00 |
34 |
139 |
10 |
6.0 |
NEAR S.
COAST OF |
|
99 |
7/7/00 |
51 |
180 |
31 |
6.1 |
|
|
100 |
7/1/00 |
34 |
139 |
10 |
6.2 |
NEAR S.
COAST OHONSHU, J |
|
101 |
6/25/00 |
31 |
131 |
10 |
6.2 |
|
|
102 |
6/23/00 |
1 |
126 |
65.3 |
6.0 |
MOLUCCA
PASSAGE |
|
103 |
6/21/00 |
14 |
145 |
112 |
6.0 |
|
|
104 |
6/21/00 |
64 |
-21 |
10 |
6.5 |
|
|
105 |
6/20/00 |
-14 |
98 |
10 |
6.1 |
|
|
106 |
6/18/00 |
-14 |
97 |
10 |
7.8 |
|
|
107 |
6/17/00 |
64 |
-20 |
10 |
6.8 |
|
|
108 |
6/16/00 |
-34 |
-70 |
120 |
6.5 |
CHILE-ARGENTINA
BORDER REG |
|
109 |
6/15/00 |
29 |
132 |
10 |
6.1 |
|
|
110 |
6/14/00 |
-18 |
176 |
33 |
6.0 |
|
|
111 |
6/14/00 |
5 |
128 |
89.5 |
6.4 |
|
|
112 |
6/14/00 |
-26 |
178 |
605 |
6.4 |
SOUTH OF |
|
113 |
6/11/00 |
-51 |
140 |
10 |
6.4 |
SOUTH OF |
|
114 |
6/10/00 |
24 |
121 |
33 |
6.4 |
|
|
115 |
6/9/00 |
30 |
138 |
485 |
6.3 |
SOUTH OF |
|
116 |
6/9/00 |
-11 |
162 |
33 |
6.1 |
|
|
117 |
6/9/00 |
-6 |
103 |
33 |
6.0 |
|
|
118 |
6/9/00 |
-5 |
152 |
33 |
6.3 |
|
|
119 |
6/7/00 |
-5 |
102 |
33 |
6.7 |
|
|
120 |
6/7/00 |
27 |
97 |
33 |
6.4 |
|
|
121 |
6/6/00 |
29 |
131 |
33 |
6.4 |
|
|
122 |
6/6/00 |
-5 |
103 |
33 |
6.2 |
|
|
123 |
6/6/00 |
41 |
33 |
10 |
6.1 |
|
|
124 |
6/4/00 |
29 |
65 |
33 |
6.0 |
|
|
125 |
6/4/00 |
-5 |
102 |
33 |
6.7 |
|
|
126 |
6/4/00 |
-5 |
102 |
33 |
7.9 |
|
|
127 |
6/3/00 |
36 |
140 |
62.3 |
6.1 |
NEAR EAST
COAST OHONSHU, |
|
128 |
6/2/00 |
45 |
-130 |
10 |
6.2 |
OFF COAST
OF |
|
129 |
5/26/00 |
11 |
139 |
33 |
6.0 |
|
|
130 |
5/21/00 |
71 |
-8 |
10 |
6.0 |
|
|
131 |
5/14/00 |
-4 |
123 |
33 |
6.3 |
|
|
132 |
5/12/00 |
36 |
71 |
108 |
6.3 |
|
|
133 |
5/12/00 |
-24 |
-66 |
225 |
7.2 |
|
|
134 |
5/8/00 |
-4 |
150 |
502 |
6.1 |
|
|
135 |
5/6/00 |
-11 |
165 |
12 |
6.3 |
|
|
136 |
5/4/00 |
-18 |
-179 |
516 |
6.5 |
|
|
137 |
5/4/00 |
-1 |
124 |
26 |
7.6 |
|
|
138 |
4/23/00 |
-28 |
-63 |
610 |
6.1 |
|
|
139 |
4/23/00 |
-28 |
-63 |
609 |
7.0 |
|
|
140 |
4/21/00 |
51 |
-178 |
33 |
6.1 |
|
|
141 |
4/18/00 |
-21 |
-176 |
221 |
6.0 |
|
|
142 |
4/13/00 |
10 |
127 |
33 |
6.0 |
PHILIPPINE |
|
143 |
4/7/00 |
-18 |
66 |
10 |
6.3 |
|
|
144 |
4/3/00 |
4 |
126 |
150 |
6.2 |
|
|
145 |
3/28/00 |
22 |
144 |
127 |
7.6 |
VOLCANO |
|
146 |
3/21/00 |
3 |
128 |
103 |
6.1 |
NORTH OF |
|
147 |
3/12/00 |
15 |
-92 |
62 |
6.3 |
NEAR COAST
OCHIAPAS, MEX |
|
148 |
3/5/00 |
-63 |
146 |
10 |
6.1 |
SOUTH OF |
|
149 |
3/4/00 |
-60 |
150 |
10 |
6.4 |
WEST OF |
|
150 |
3/3/00 |
-7 |
144 |
10 |
6.6 |
PAPUA NEW |
|
151 |
3/3/00 |
-7 |
128 |
142 |
6.4 |
|
|
152 |
2/29/00 |
-18 |
169 |
33 |
6.0 |
|
|
153 |
2/29/00 |
-50 |
-114 |
10 |
6.0 |
|
|
154 |
2/28/00 |
-18 |
-179 |
538 |
6.0 |
|
|
155 |
2/26/00 |
9 |
-79 |
65 |
6.1 |
|
|
156 |
2/26/00 |
14 |
145 |
132 |
6.2 |
|
|
157 |
2/25/00 |
-20 |
174 |
33 |
7.1 |
|
|
158 |
2/13/00 |
43 |
132 |
514 |
6.0 |
E.
USSR-N.E. |
|
159 |
2/6/00 |
-6 |
151 |
33 |
6.6 |
|
|
160 |
2/3/00 |
65 |
-154 |
7.3 |
6.1 |
|
|
161 |
1/28/00 |
26 |
124 |
194 |
6.0 |
NORTHEAST
OF |
|
162 |
1/28/00 |
43 |
147 |
61.1 |
6.8 |
|
|
163 |
1/26/00 |
-17 |
-174 |
33 |
6.3 |
|
|
164 |
1/20/00 |
44 |
-127 |
10 |
6.1 |
OFCOAST OF |
|
165 |
1/20/00 |
57 |
-162 |
221 |
6.0 |
|
|
166 |
1/19/00 |
36 |
70 |
207 |
6.0 |
|
|
167 |
1/15/00 |
-21 |
-179 |
633 |
6.0 |
|
|
168 |
1/13/00 |
-18 |
-179 |
535 |
6.2 |
|
|
169 |
1/9/00 |
-19 |
174 |
33 |
6.5 |
|
|
170 |
1/8/00 |
-17 |
-174 |
183 |
7.2 |
|
|
171 |
1/8/00 |
-23 |
-70 |
36 |
6.4 |
NEAR COAST
OF NORTHERN CHI |
|
172 |
1/8/00 |
-10 |
160 |
33 |
6.4 |
|
|
173 |
1/6/00 |
16 |
119 |
33 |
6.2 |
LUZON, PHILIPPINE
|
|
174 |
1/6/00 |
58 |
-137 |
1 |
6.2 |
|
|
175 |
1/5/00 |
-11 |
165 |
33 |
6.1 |
|
|
176 |
1/1/00 |
-61 |
154 |
10 |
6.0 |
WEST OF |
Figure 6. Earthquakes of magnitude greater than or equal to 6.0 for the calendar year 2000 are shown. The columns are: Date (year/month/day); Time (HR:MIN:SEC, in UTC time); Lat (latitude in degrees north, or south, negative latitudes are south); Lon (longitude in degrees east, west, negative longitudes are west); Depth (depth of focus in km); Mag (Magnitude; Ml = local magnitude, Mb = body wave magnitude, Ms = Surface wave magnitude, Mw = moment magnitude, Me = Energy magnitude); Data column is a code for the source of the data (WHDF = Weekly Hypocenter Data File, MHDF = Monthly Hypocenter Data File, QED = USGS Quick Epicenter Determination file, FNG = USGS Finger data file); Location (brief geographical description of the region where the earthquake occurred). Many events have more than one magnitude estimate listed or are listed twice. Multiple listings for the same event can be recognized by noting that the date, time and location values are exactly the same for two or more lines on the list. A total of 389 lines (representing 176 earthquakes of magnitude 6.0 or greater) is contained on the list. For efficiency of space, events have been deleted from this list corresponding to dates from January 20, 2000 to November 29, 2000. Note that the events are listed in order with the most recent events at the top of the list. The list shown here was obtained in ASCII format from the IRIS event search web site. It was then copied and pasted into MS Word and converted to Courier New, size 8 font. Tabs used as delimiters were replaced (Word Find and Replace commands in the Edit tool) with spaces. The headings at the top were added.
Date Time Latitude Longitude Depth Mag Type Data Location
(yyy/mm/dd) (hh:mm:ss.s) (- = S) (- = W) (km) 2000/12/28 04:34:28.6000 -4.037 152.378 33 6.2 MW QED NEW BRITAIN 2000/12/23 07:13:23.8000 -7.901 135.801 61 6.0 MW QED AROE ISLANDS REGION 2000/12/22 10:13:00.8000 44.833 147.157 137 6.2 MW QED KURIL ISLANDS 2000/12/21 02:41:23.4000 -5.298 154.031 386 6.0 MW QED SOLOMON ISLANDS 2000/12/21 01:01:27.8000 -5.74 151.126 33 6.5 MS QED NEW BRITAIN 2000/12/20 16:49:43.2000 -9.231 154.328 33 6.6 MW QED DENTRECASTEAUX ISLANDS REG 2000/12/20 11:23:56.9000 -39.061 -74.425 33 6.4 MW QED OFF COAST OF CENTRAL CHILE 2000/12/19 13:11:47.4000 11.782 144.76 33 6.3 MB QED SOUTH OF MARIANA ISLANDS 2000/12/18 01:19:20.0000 -21.107 -179.072 600 6.6 MW QED FIJI ISLANDS REGION 2000/12/15 16:44:44.9000 38.608 31.058 10 6.1 MW QED TURKEY 2000/12/12 05:26:45.8000 6.02 -82.682 10 6.1 MW QED SOUTH OF PANAMA 2000/12/06 22:57:40.4000 -4.184 152.771 31 6.6 MS QED NEW BRITAIN 2000/12/06 17:11:06.7000 39.625 54.772 30 7.5 MS QED TURKMEN SSR 2000/12/04 04:43:09.6000 14.906 -93.898 33 6.0 MW QED NEAR COAST OF CHIAPAS 2000/12/04 04:42:14.4000 14.958 -93.801 33 6.2 MS QED NEAR COAST OF CHIAPAS 2000/11/29 10:35:46.0000 63.9 -150.33 10 6.0 ML QED CENTRAL ALASKA 2000/11/29 10:25:14.1000 -24.504 -70.549 58 6.4 MW QED NEAR COAST OF NORTHERN CHI . . . . . . . . . . . . . . . . . . . . . . . . . . . . . . . . . . . . . . . . . . . . .2000/01/20 09:41:47.3400 43.649 -127.257 10 6.4 ME MHDF OFF COAST OF OREGON 2000/01/20 09:41:47.3400 43.649 -127.257 10 6.1 MW MHDF OFF COAST OF OREGON 2000/01/20 06:13:02.6600 56.618 -161.869 220.8 6.0 ME MHDF ALASKA PENINSULA 2000/01/19 07:09:33.5800 36.372 70.379 206.9 6.0 MW MHDF HINDU KUSH REGION 2000/01/15 12:49:45.0700 -21.216 -179.255 632.8 6.0 MW MHDF FIJI ISLANDS REGION 2000/01/15 12:49:45.0700 -21.216 -179.255 632.8 6.0 MW MHDF FIJI ISLANDS REGION 2000/01/13 20:07:14.4400 -17.61 -178.742 535 6.2 MW MHDF FIJI ISLANDS REGION 2000/01/13 20:07:14.4400 -17.61 -178.742 535 6.2 MW MHDF FIJI ISLANDS REGION 2000/01/09 21:54:40.4900 -18.823 174.37 33 6.4 MS MHDF FIJI ISLANDS REGION 2000/01/09 21:54:40.4900 -18.823 174.37 33 6.5 MW MHDF FIJI ISLANDS REGION 2000/01/09 21:54:40.4900 -18.823 174.37 33 6.9 ME MHDF FIJI ISLANDS 2000/01/08 16:47:20.5800 -16.925 -174.248 183.4 6.5 MB MHDF TONGA ISLANDS 2000/01/08 16:47:20.5800 -16.925 -174.248 183.4 6.6 MS MHDF TONGA ISLANDS 2000/01/08 16:47:20.5800 -16.925 -174.248 183.4 7.0 ME MHDF TONGA ISLANDS 2000/01/08 16:47:20.5800 -16.925 -174.248 183.4 7.2 MW MHDF TONGA ISLANDS 2000/01/08 11:59:21.8400 -23.169 -70.122 36 6.4 MW MHDF NEAR COAST OF NORTHERN CHI 2000/01/08 11:59:21.8400 -23.169 -70.122 36 6.1 ME MHDF NEAR COAST OF NORTHERN CHI 2000/01/08 01:19:46.6600 -9.805 159.811 33 6.3 ME MHDF SOLOMON ISLANDS 2000/01/08 01:19:46.6600 -9.805 159.811 33 6.4 MS MHDF SOLOMON ISLANDS 2000/01/08 01:19:46.6600 -9.805 159.811 33 6.4 MW MHDF SOLOMON ISLANDS 2000/01/06 21:31:06.2200 16.095 119.484 33 6.2 MW MHDF LUZON, PHILIPPINE ISLANDS 2000/01/06 10:42:25.0000 58.04 -136.87 1 6.1 ML MHDF SOUTHEASTERN ALASKA 2000/01/06 10:42:25.0000 58.04 -136.87 1 6.2 ME MHDF SOUTHEASTERN ALASKA 2000/01/05 07:40:40.7300 -11.371 165.378 33 6.0 MS MHDF SANTA CRUZ ISLANDS 2000/01/05 07:40:40.7300 -11.371 165.378 33 6.1 MW MHDF SANTA CRUZ ISLANDS 2000/01/05 07:40:40.7300 -11.371 165.378 33 6.1 MW MHDF SANTA CRUZ ISLANDS 2000/01/01 05:58:19.7800 -60.722 153.67 10 6.0 MW MHDF WEST OF MACQUARIE ISLAND 2000/01/01 05:58:19.7800 -60.722 153.67 10 6.0 MW MHDF WEST OF MACQUARIE ISLAND

Figure 7. Students plotting epicenters using colored, adhesive dots on a world map.
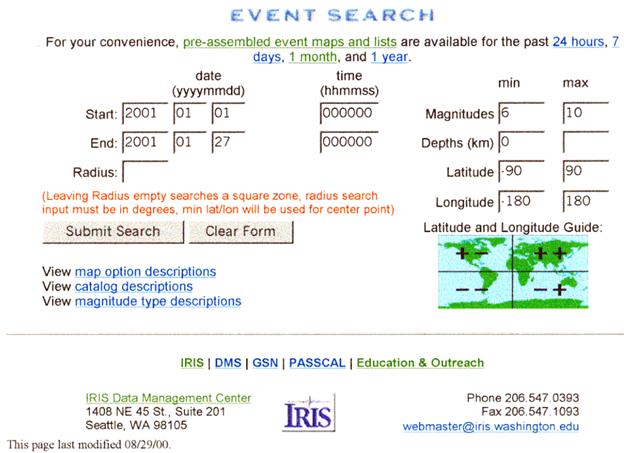
Figure 8. Copy of the event search form from the IRIS (http://www.iris.edu) site. Sample data entries are shown. See text for additional details.
2001/01/26 03:16:41.0000 23.4 70.32 23.6 7.9 MS FINGER INDIA 2001/01/19 08:10:14.0000 -11.64 166.31 49.8 6.1 MS FINGER SANTA CRUZ ISLANDS 2001/01/16 13:25:01.1000 -3.942 101.81 33 6.8 MW QED SOUTHERN SUMATERA 2001/01/15 05:52:15.5000 -40.369 78.365 10 6.4 MW QED MID-INDIAN RISE 2001/01/13 17:33:30.3000 13.063 -88.787 39 7.8 MS QED EL SALVADOR 2001/01/11 00:04:06.5000 49.199 -128.873 10 6.1 MW QED VANCOUVER ISLAND REGION 2001/01/10 16:02:43.4000 57.019 -153.398 33 7.1 MW QED KODIAK ISLAND REGION 2001/01/09 16:49:28.9000 -14.898 167.154 111 7.0 MW QED VANUATU ISLANDS 2001/01/07 10:18:23.7000 -33.409 -72.084 33 6.0 MW QED OFF COAST OF CENTRAL CHILE 2001/01/02 07:30:03.7000 6.747 126.781 33 6.3 MW QED MINDANAO , PHILIPPINE ISLAN 2001/01/01 08:54:31.6000 6.634 126.833 33 6.0 MS QED MINDANAO , PHILIPPINE ISLAN 2001/01/01 06:57:04.6000 6.97 126.613 33 7.4 MW QED MINDANAO , PHILIPPINE ISLAN
Figure 9. Earthquake list that was generated by submitting the data on the event search form shown in Figure 8. The list was requested in ASCII format and then copied and pasted into a MS Word document. The font was changed to Courier New, font size 8, and the tabs are replaced with a space using the find and replace tool under the edit command. Column headings are as described in the caption for Figure 6.
Figure 10. Legend for plotting earthquakes of different magnitude with different sized dots and of different depths with different colored dots.
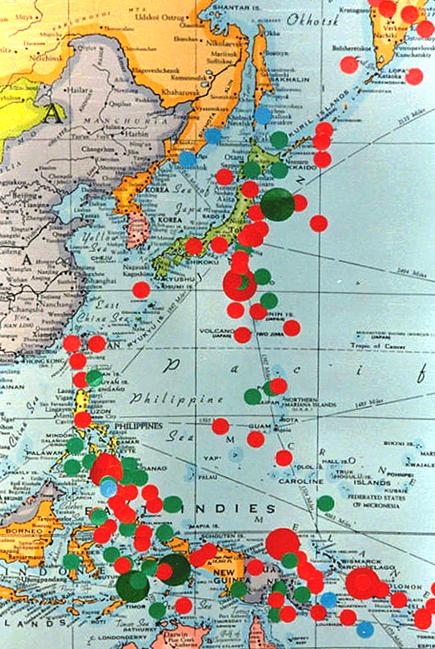
Figure 11. Example
of epicenter plotting with colored dots.
Close-up view of an area of a world map in which adhesive dots are used
to plot locations of earthquakes as in Option 2. The area is the western Pacific, including
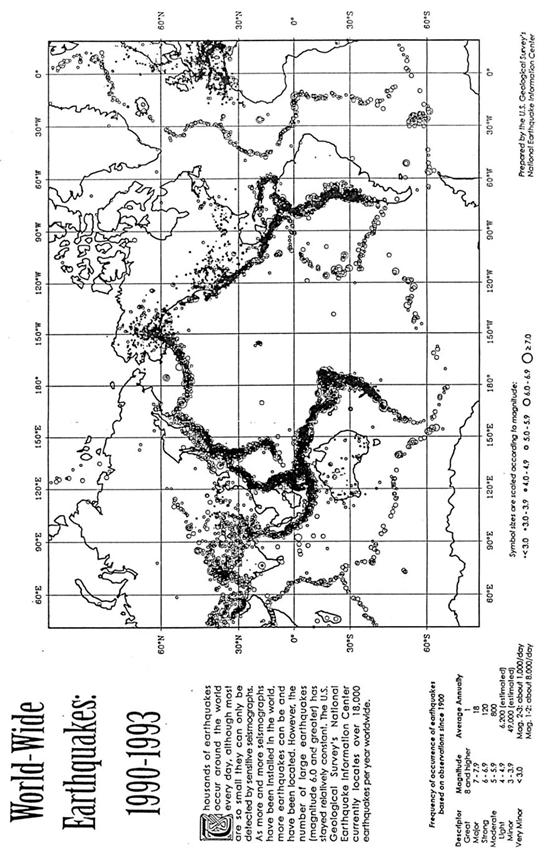
Figure 12. Map of worldwide earthquakes, 1990-1993. Figure from the USGS.
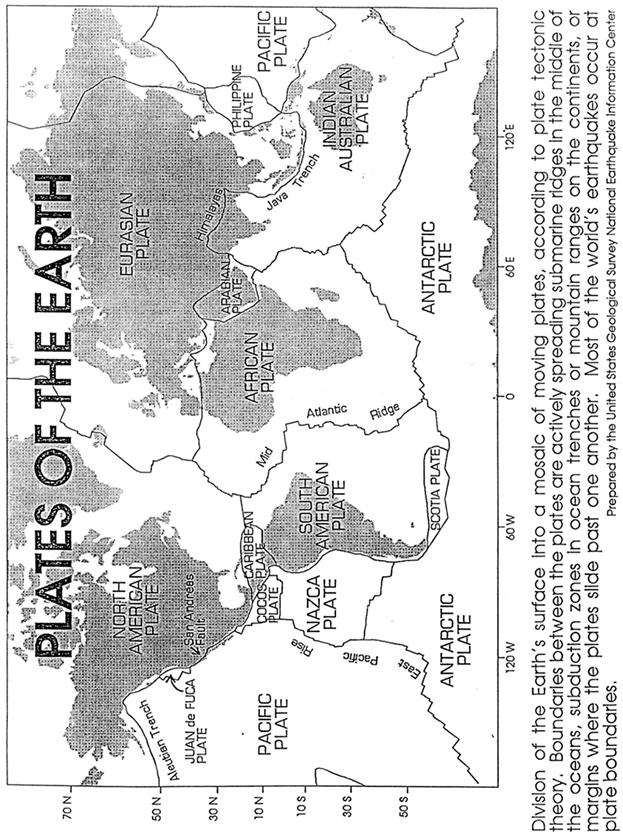
Figure 13. The Earth’s plates and plate boundaries. Figure from the USGS.
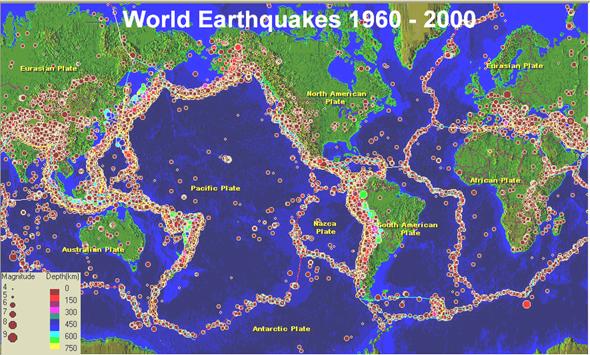
Figure 14. Earth's plates and earthquake epicenters from 1960-2000. Epicenters are shown by dots with dot size proportional to earthquake magnitude. Color of dots indicates depth of earthquake focus. See legend in lower left hand corner. Plate boundaries are thin lines (red = divergent boundaries; yellow = convergent boundaries; blue = transform boundaries). Figure modified from SeisVolE screen display.
Figure 15. Example
of a cross-section plot showing the depths of earthquakes in a subduction
zone. The data are from western