Flowcharting:
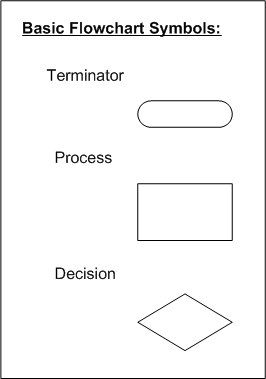
A flowchart is a graphical representation of an algorithm. Flowcharts are often restricted to a one page limit to keep things simple. The basic shapes that make up a flowchart are shown to the right. These will be the only actual symbols used for this site. In addition to these symbols, flow lines and arrows are used to represent the program flow through the steps.The Terminal symbol is used as both the entry and exit point of a flowchart. The Process symbol is used to represent a process that needs to be completed. This process could be as simple as adding two numbers together to as complicated as calibrating a piece of machinery. The Decision symbol is used to represent a "fork in the road". This is the place in the algorithm where a decision must be made.
Structured flowcharts, by definition, have a single entry point and a single exit point. Structured programming forces this property. A flowchart can be used as a powerful tool to make the transformation from an algorithm to software. This transformation will become more clear when dealing with the C programming structures for program control which will be covered later.
Flowcharts are also a good source of documentation. This author has to generate flowcharts, for documentation purposes, more than once, for software that was written by other programmers.
Flowcharts are not only used to document software. Flowcharts can also be used to document any process flow. For example, the process for problem solving can be shown graphically with a flowchart:
In the above flowchart, the process of generating a solution is shown as a single block. In reality, the process of generating a software solution is more complex. As mentioned earlier, processes are typically shown as a single block to simplify the flowchart. There are several rules that can be applied to structured flowcharting. The first rule is to start with the simplest flowchart (like the one above). The second rule states that any process rectangle can be replaced by a sequence of processes. The third rule states that any process can be replaced by any control structure (which contain decisions and actions). These rules can be applied in any order and repeated as many times as necessary. The following diagram shows some of the above rules being applied to a flowchart:
The flowchart below shows a more detailed flowchart for the "Generate a Solution" process shown above in the Problem Solving Flowchart. This Software Development Flowchart utilizes some of the rules from above.
Both of the above flowcharts have decisions at the bottom of the flowchart. These decisions are questions about the operation of the software or the overall solution. In either case, if the software or solution contains errors, the flow is diverted back to a previous step. The previous steps are then repeated to refine or rework them in an attempt to reach a desirable result. Again, the results are tested and the process repeats until the desired results are reached.
The above flowcharts deal with the processes involved in problem solving and software generation. These are definitely good examples of using a flowchart to illustrate a process or algorithm, but they are not processes that one would implement with a microcontroller. Therefore, the algorithms developed earlier during the section on Algorithm Development will be revisited. These processes are more like a "real world" application that a programmer may have to solve with a microcontroller.
Example 1 - Adding a series of numbers.
|
Last Updated on March 19, 2003 |
main | contact | EET 209 |