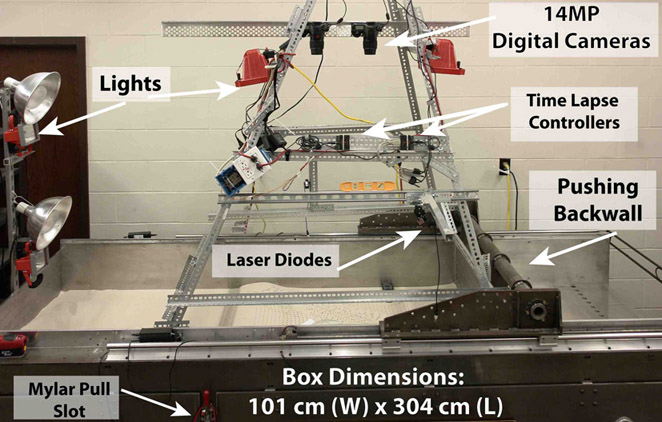
Figure 1: (above) Schematic of Analog Model Setup
Experimental setup used for quantitative analog models. The sandbox has interior width of 101 cm and length of 304 cm; these dimensions are essential for minimizing unwanted edge effects and for experiments with significant out-of-cross-section motion. Convergent motion can be motivated by either a backwall push or by Mylar pull depending on the type and the goal of the experiment. Motion is achieved using a digital step motor that is controlled by a PC. Precision control of the experiment easily allows for rates less than a cm/day to be achieved, which are important for scaling when viscous materials are used. Mounted above the box is the camera gantry on which there are two 14 MP digital SLR cameras, two digital time-lapse controllers for the lights and the cameras, and two laser diodes that can be used to measure topography. The automation of image acquisition allows experiments to proceed for several days where data can be collected at precise intervals.
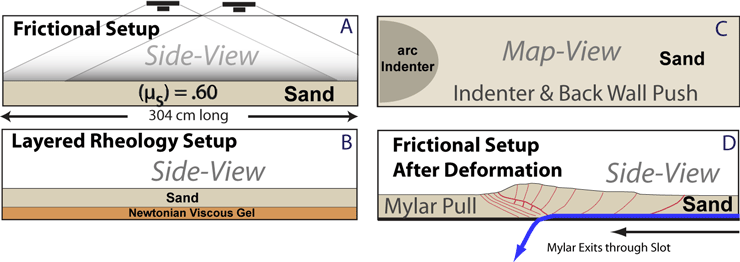
Figure 2: (above) Schematic of Analog Model Setup
Four panels showing potential experimental setups for frictional, and layered friction over viscous models (A and B) and for indenter or Mylar pull convergence (C and D) configurations. Setup ‘A’ also shows schematically the location of cameras for stereo imaging, in side-view (Note: thicknesses and heights of camera are not to scale). Panel ‘D’ schematically shows the deformation resulting from a sheet pulled through a slot to from a doubly vergent wedge. The red lines indicate the location of thrust faults. The frictional material used is a well-sorted sub-rounded sand (μ = ~0.6) and the viscous material is Newtonian gel (η =10^5 Pa.s) with an n=~1.
Example of a bi-vergent frictional wedge with a 45º oblquity to convergence. The linked move contains an image of experiment, profiles of margin-normal and margin parallel velocity and corresponding strain and shear rate.
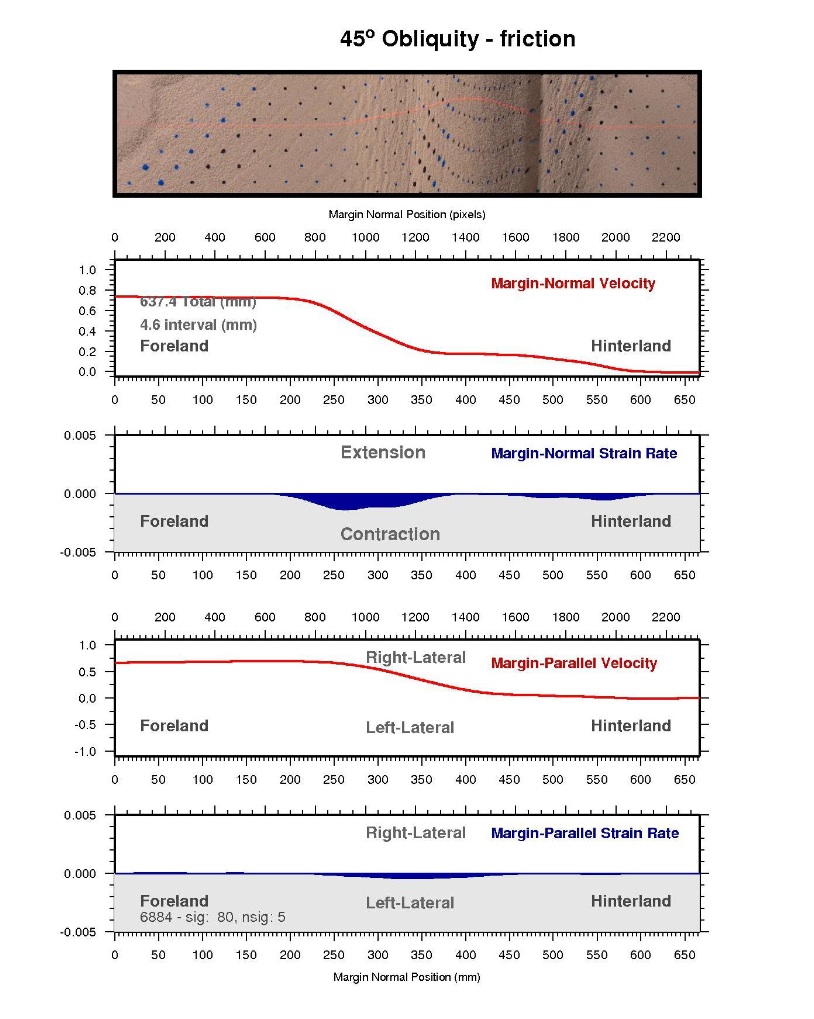
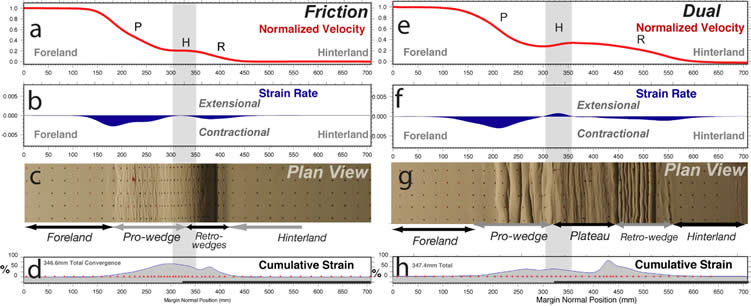
Figure a-h: Frictional and Dual Experiments at θ=0º. Panels show margin-normal velocity (4a and 4e) and strain rate profiles (4b and 4f), images (plan-view) corresponding to the end of the measured interval (4c and 4g), and cumulative strain (4d and 4h). Both runs have comparable amounts of cumulative convergence. The letters (P – prowedge; H – topographic high; and R - retrowedges) on the velocity profiles correspond to distinct zones in the models. Both experiments show contractional deformation corresponding to the pro- and retro-wedge deformation fronts. However in panel ‘f’ (layered model) the positive strain rate at the highest topography, near the ‘H’, indicates extensional deformation. This extension may occur in such friction/viscous experiments under the right conditions but never does in frictional experiments (Haq and Davis 2008)
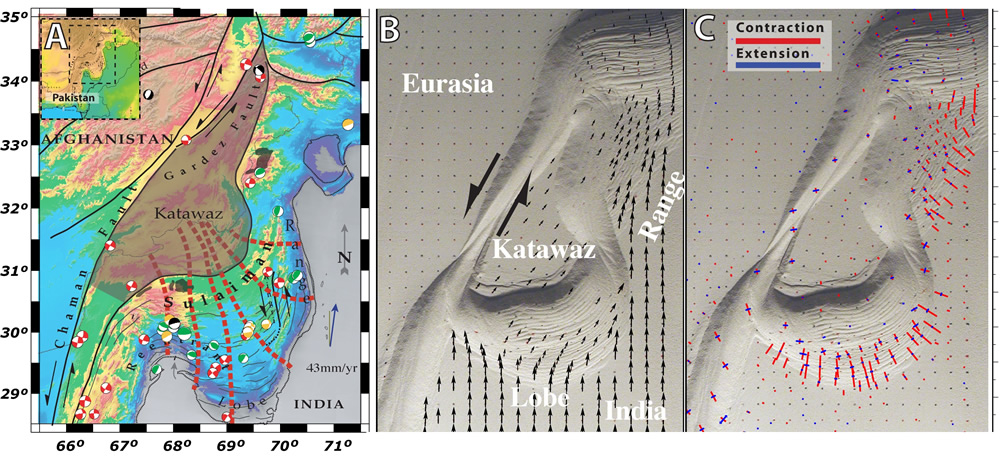
Analog Model of Curved Sulaiman Fold-belts in Pakistan.
A) Etopo5 topography data overlain with location of the major faults including the Chaman left-lateral fault zone, ophiolites (Haq 2004) (dark patches), and the Katawaz Basin (and interpreted location of the Katawaz Block large shaded region). Also shown are the geologically observed shortening direction (red-dashed lines, from Humayon et al., 1991) and color-coded earthquakes from the CMT catalog. B) Frictional model overlain with velocities for a small interval and; C) the principal strain rate axis. Note how the orientations of the strain axis rotate around the Lobe.
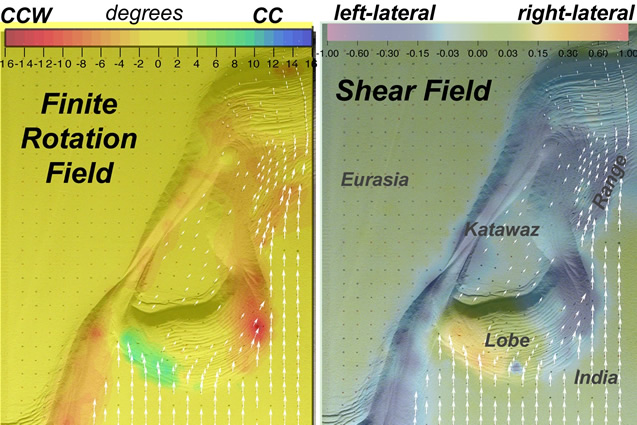
Rotation and Shear Fields From the Deformation Tensor.
At left, same experiment as in Figure 3. The finite rotation and shear fields are overlain with the velocity field for a late stage of the experiment. Rotation rates are highest at the side of the ‘Sulaiman Lobe’ where obliquity is largest to relative motion and are of opposite signs around the Lobe. These fields can be easily calculated for all stages of the experiment.
Single-Sided Wedge (undergraduate experiment)