|
Every Pebble Tells a Story – Additional Materials 1 L. Braile, S. Braile, Happy Hollow School, August, 2005,
revised July, 2009 braile@purdue.edu, http://web.ics.purdue.edu/~braile
|
|

Additional Materials for the Every Pebble Tells a Story activity: This document contains diagrams and tables to accompany the Every Pebble Tells a Story activity. These materials are primarily intended to be teacher resources. However, some of the diagrams (particularly numbers 1 and 2 in the list below), descriptions and tables can be used by students in completing the activity. Some of the materials are also designed to be used with mineral and rock identification study that may be performed prior to (or after) the Every Pebble Tells a Story activity. The Every Pebble Tells a Story activity can be found at: http://web.ics.purdue.edu/~braile/edumod/pebble/pebble.htm. MS Word and PDF versions of this document (Every Pebble Tells a Story – Additional Materials) are located at:
http://web.ics.purdue.edu/~braile/edumod/pebble/pebbleAM.doc, and
http://web.ics.purdue.edu/~braile/edumod/pebble/pebbleAM.pdf. The following diagrams and tables are
included here:
1. The Rock Cycle diagram.
2. Simplified Rock Identification Flowchart.
3. Mineral Identification Flowchart.
4. Rock Identification Flowchart.
5. Simplified Sediment Size and Names Table.
6. Moh’s Scale of Hardness Table.
7. Schematic diagrams illustrating the Principle of Superposition, the Principle of Original Horizontality, Cross-cutting Relationships and Unconformities, and Sedimentary Cross-bedding.
8. Sample Rubric for Every Pebble Tells a Story activity.
9. Mineral Key Table – Nonmetallic Minerals.
10. Mineral Key Table – Metallic Minerals.
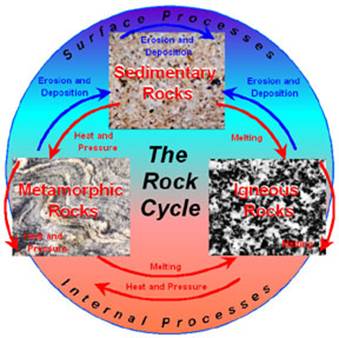
1. The Rock Cycle: The rock cycle schematically illustrates the processes of rock formation through surface and internal processes (represented by the red and blue arrows) in the Earth. Most of these processes, especially at large scale, are the result of plate tectonics. As the diagram shows, sedimentary rocks are formed by erosion and deposition (and subsequent compaction and cementation of the sediments into rock; usually by burial by additional accumulation of sediments) of igneous, metamorphic and previously-existing sedimentary rock by surface processes (mechanical and chemical erosion by wind and water). Igneous rocks are formed by melting (and subsequent cooling and crystallization into solid rock) of sedimentary, metamorphic or pre-existing igneous rocks. Because the melting point of typical Earth materials ranges from about 600 and 1300 degrees Celsius, the molten material that forms igneous rocks comes from depths in the Earth where these high temperatures exist (tens to hundreds of kilometers). Metamorphic rocks are formed by re-crystallization (without large scale melting of the material) caused to heat and pressure, of sedimentary, igneous or pre-existing metamorphic rocks. Metamorphic processes
occur at depths of a few kilometers below the surface to a many tens of kilometers depth. Because igneous and metamorphic processes occur at significant depth within the Earth, the exposure of igneous and metamorphic rocks at the surface means that these rocks have been uplifted to the surface after formation, often by plate tectonic processes. Volcanic igneous rocks are the result of liquid rock materials (called magma; molten rock; or lava, when it reaches the surface) rising from depths within the Earth (typically 20 to 150 km depth or more) and erupting on the surface where they cool rapidly.
An illustration of the rock cycle in relation to plate tectonics (and information on igneous, sedimentary and metamorphic rocks) can be found at: http://www.eos.ubc.ca/courses/eosc221/rock_cycle/rockcycle.html. The GEODe III CD-ROM from Prentice-Hall also contains an excellent description and illustrations of the rock cycle (http://www.pearsonschool.com/index.cfm?PMDbSiteId=2781&PMDbSolutionId=6724&PMDbSubSolutionId=6732&PMDbCategoryId=814&PMDbSubCategoryId=&PMDbProgramId=52981&level=4&locator=PSZ15f).
A recent and well-illustrated resource for the rock cycle and mineral and rock information is the rock and mineral e.guide published by Dorling Kindersley and Google (Farndon, 2005)*. Much of the information from this book and additional web-based materials can be accessed online at: http://www.rockandmineral.dke-guides.com/. From this webpage, select “Free images to download an print” and then select the rock cycle thumbnail to open an illustration of the rock cycle. From this diagram, try to determine the rock cycle processes that are indicated by the color coded arrows (the complete figure is in the e.guide). Also, from the above mentioned page, type “rock cycle” in the Keyword search box to access other rock cycle illustrations. The resulting page contains links to experiments and animations related to rock processes and the rock cycle.
* Farndon, John, eguides: Rock and Mineral, Dorling
Kindersley Publishers,
Common surface sedimentary processes and rock characteristics:
a. Mechanical and chemical erosion resulting in rock units being broken or weathered into fragments of various sizes.
b. Rounding of rock fragments and particles by the actions of water (usually in rivers and beaches) and wind.
c. Sorting of sediments during transport by wind and water such that sedimentary deposits often contain fragments (sediments or particles) that are about the same size or size range.
d. Most sedimentary rocks are deposited in distinct layers. Within thick layers of sedimentary rocks, small scale layering is almost always present as well so that small samples (pebbles) display layers.
e. Mineral sorting (mechanical and chemical weathering of the less resistant minerals and particles) during erosion and transport often results in sedimentary rocks that are primarily made up of one mineral (such as quartz-rich sandstones) or a small number of minerals.
f. Chemical sedimentary rocks (limestone, salt, gypsum, etc.) are formed through precipitation of chemicals (in distinct mineral compositions) in water. In limestone deposition, this process is often aided by biological formation of limestone materials, for example, in the shells of marine animals.
g. After rock formation, rock materials may become weathered (some minerals, especially on the exposed surface of the rock become chemically altered and tend to break up or be dissolved) at the surface, stained by the chemicals in fluids that flow through the pore spaces in the rocks, or injected by veins (chemical deposits, usually calcite or quartz, that fill cracks within a rock. These veins often cut across preexisting layering indicating that the veins were formed after the rock formation (cross-cutting relationships).
Common igneous processes and rock characteristics:
a. Melting, during the igneous process, forms a melt (magma) with relatively uniform chemical composition. During subsequent cooling (in the Earth’s crust to form plutonic igneous rocks, such as granite, or on the Earth’s surface to form volcanic igneous rocks, such as basalt), the melt crystallizes resulting in crystals of distinct mineral types. In plutonic igneous rocks, the cooling is slow enough to allow relatively large crystals to develop. In volcanic igneous rocks, the cooling is much more rapid and the resulting crystals are mostly microscopic in size. In both cases, the crystals display a characteristic interlocking grains texture (see igneous rocks photo in the above rock cycle diagram), and the rocks generally lack distinct layering.
b. Because crystals of different types of minerals form during the cooling and crystallization, plutonic igneous rocks often show a “salt and pepper” appearance (see igneous rocks photo in the above rock cycle diagram).
c. Volcanic igneous rocks often have gas bubbles (vesicles) visible. A rough (“aa” [pronounced ah-ah]) or ropey (pahoehoe [pronounced pah-hoy-hoy]) texture in newly erupted volcanic rocks is also characteristic. Surface processes usually smooth out these features over time.
d. Plutonic igneous rocks often contain xenoliths which are fragments of un-melted rock that the magma broke off from adjacent rock units as it melted or intruded into the crust or mantle. The xenoliths are then mixed in with the magma, and, although they do not completely melt, they are metamorphosed by the intense heat of the surrounding magma.
e. Volcanic igneous rocks often include phenocrysts which are mineral crystals that form in the magma early during cooling (most likely before eruption) and thus can grow to relatively large size. As the magma erupts at the surface, the remaining molten rock cools quickly resulting in a fine-grained matrix surrounding the phenocrysts.
Common metamorphic processes and rock characteristics:
a. Metamorphic rocks are igneous, sedimentary or previously-metamorphosed rocks that are transformed into new metamorphic rock by heat and pressure, usually many kilometers beneath the Earth’s surface. The heat and pressure cause re-crystallization of the original minerals in the parent rock and development of metamorphic texture.
b. Metamorphic textures are alignment of rectangular, platy, and elongated crystals; development of shiny surfaces by the conversion of clay minerals to mica; the generation of metamorphic layering called foliation (“wavy” layering; see the metamorphic rocks photo in the above rock cycle diagram); injection of minerals (usually quartz and feldspar) in veins and dikes that often cut across the foliation; and the development of large crystals (called porphoroblasts, such as garnet or staurolite) in the metamorphic mineral matrix.
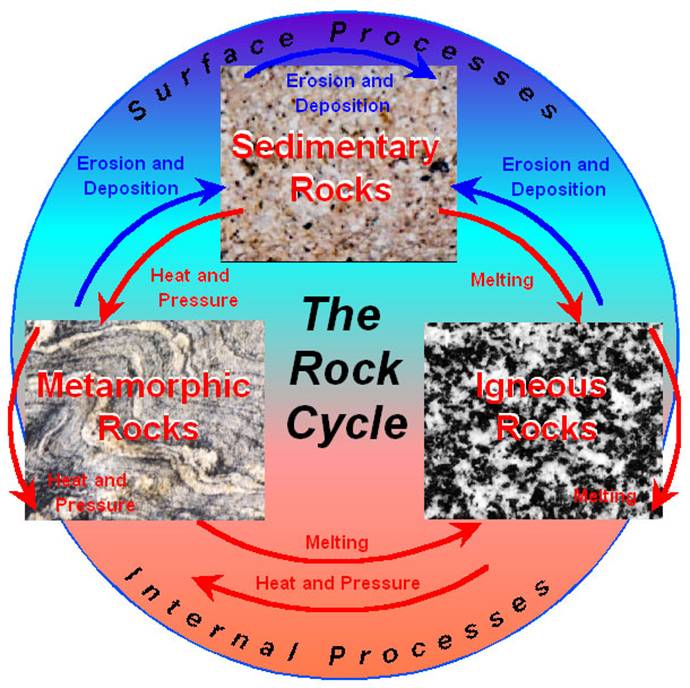
2. Simplified Rock Identification and Origin Flowchart: The Simplified Rock Identification and Origin Flowchart is designed primarily to determine if a rock sample is an igneous, sedimentary or metamorphic rock. The flowchart also contains additional classification information in the right hand column of boxes. This flowchart is very useful for the Every Pebble Tells a Story activity because it helps infer the origin of a rock sample.
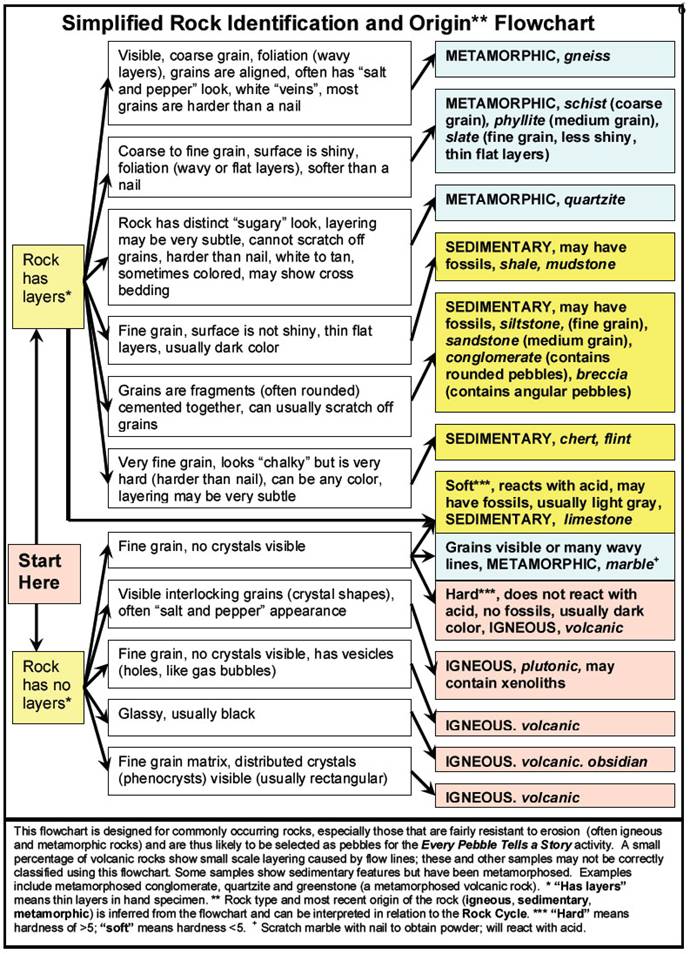
3. Mineral Identification Flowchart: The Mineral Identification Flowchart is designed primarily for the analysis and study of minerals. It may be useful in the Every Pebble Tells a Story activity for the identification of the mineral type of individual crystals in samples with large grains visible (plutonic rocks, gneiss, phenocrysts in volcanic rocks and porphoroblasts in metamorphic rocks. Photographs of many minerals can be found at: http://www.soes.soton.ac.uk/resources/collection/minerals/, http://www.theimage.com/, http://www.galleries.com/ and http://www2.nature.nps.gov/geology/usgsnps/rxmin/mineral.html. An online mineral quiz can be found at: http://www.soes.soton.ac.uk/resources/collection/minerals/min-quiz/index.htm. Mineral identification software (MinLogic) can be downloaded from: http://www.ccp14.ac.uk/ccp/ccp14/ftp-mirror/krumm/Software/windows/minlogic/ (click on minlogic.zip to download, then unzip and install). The software allows one to use mineral properties (hardness, cleavage, etc.) to identify the mineral or to view the physical properties of many minerals in the list in MinLogic.
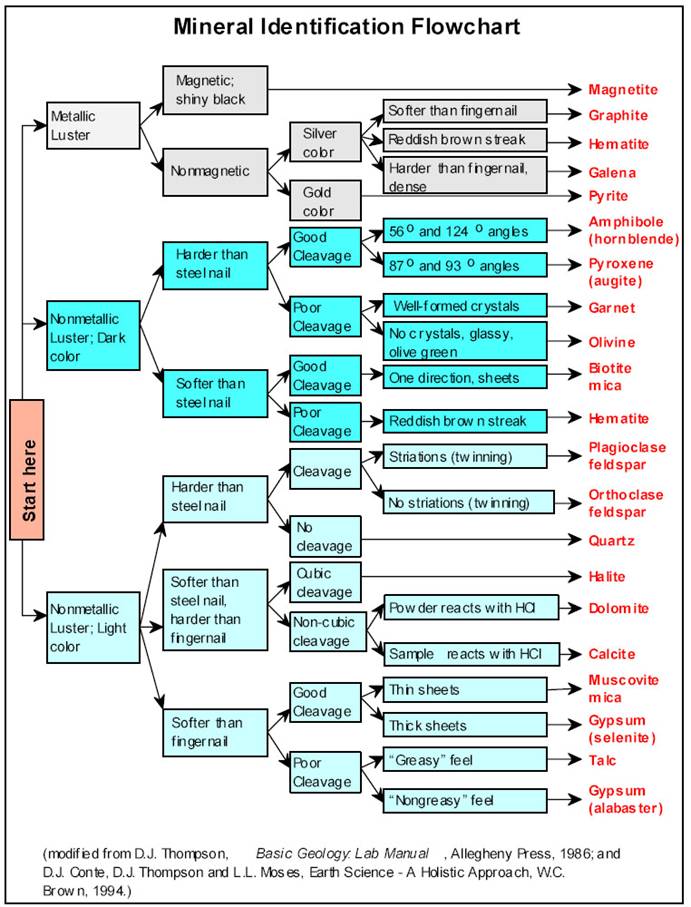
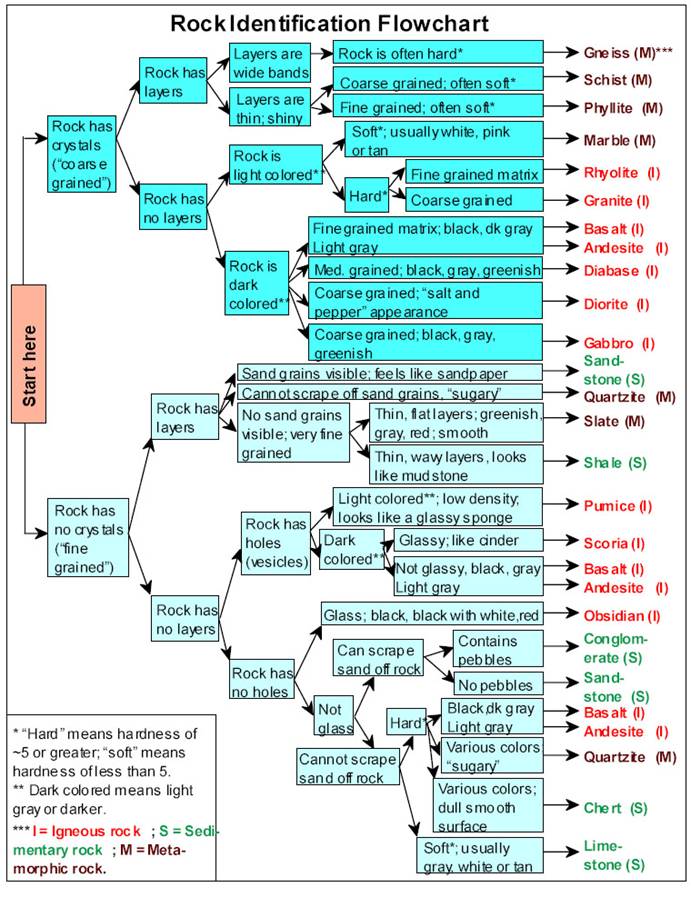
4. Rock Identification Flowchart: The Rock Identification Flowchart is designed primarily for the analysis and study of rocks. In addition to rock origin (igneous, sedimentary or metamorphic), the specific rock type or name can be determined for many commonly-occurring rock types. It may be useful in the Every Pebble Tells a Story activity for the identification of specific rock type. Photographs of many rocks can be found at: http://www.soes.soton.ac.uk/resources/collection/minerals/. Additional rock keys can be found at:
http://www.rockhounds.com/rockshop/rockkey/. http://jersey.uoregon.edu/~mstrick/MinRockID/MinRockIndex.html http://geomaps.wr.usgs.gov/parks/rxmin/index.html.
Thin section images (photos of thin slices of rock viewed with polarized light under a microscope) for some rocks and minerals can be found at:
http://geology.isu.edu/geostac/Field_Exercise/Cassia_mtns/thinsect.html
http://projects.kmi.open.ac.uk/microscope/
http://www.uwgb.edu/dutchs/petrolgy/thinsect.htm
http://www.microscopy-uk.org.uk/mag/artfeb04/iwouslides2.html
http://www.geolab.unc.edu/Petunia/IgMetAtlas/minerals/minerals.html.
5. Simplified Sediment Size and Name Table: The Table (below) shows the size range and names of sediment, particles or grains that appear in sedimentary deposits or rocks. The Table shows that grains, particles or rock fragments of size 2 to 64 mm (0.2 to 6.4 cm) in diameter are called pebbles. Larger rock fragments are cobbles or boulders. Sand, silt and clay sized particles make up fine-grained sedimentary deposits and sedimentary rocks.
|
Simplified Sediment Size
and Names Table |
|
Diameter Grain Size (mm) Name Larger
Cobble 64
---------------------- Pebble 2
---------------------- Sand 1/16
---------------------- Silt 1/256 ---------------------- Smaller Clay |
6. Moh’s Scale of Hardness: Moh’s Scale of Hardness is a standard scale to testing the hardness of minerals. Hardness is a diagnostic feature of many minerals so this property provides a useful test to help identify unknown mineral samples. Using some simple “tools” (fingernail, penny, steel nail, etc.), one can test the hardness of a mineral sample and determine its approximate hardness.
|
Moh’s Scale of Hardness Relative hardness of specific minerals and some common materials for testing hardness of unknown mineral samples |
|
“To 1. Talc get 2. Gypsum ß
Fingernail (~2 ½) calcite 3. Calcite ß Penny (~3) from 4. Fluorite any 5. Apatite ß Steel nail (~5) ß Glass or knife blade (~5 1/2) old 6. Orthoclase (feldspar) ß Steel file (~6 ½) quarry 7. Quartz ß Quartz crystal (7) takes 8. Topaz constant 9. Corundum digging.” 10. Diamond |
|
An unknown mineral can be tested for hardness by trying to scratch it with the test materials or trying to scratch the test materials with the unknown mineral sample. For example, gypsum or talc can be scratched by your fingernail but will not scratch your fingernail or a copper penny. Orthoclase (and most other minerals of the commonly occurring feldspar family) will scratch glass or a knife blade (and cannot be scratched by glass or a knife blade) but can be scratched by a steel file or a quartz crystal. To remember the hardness scale, use the mnemonic: To Get Calcite From Any Old Quarry Takes Constant Digging. The first letter of each word is the first letter of the mineral in the hardness scale in order from one to ten with one being the softest mineral and ten being the hardest mineral. |
7. Schematic diagrams illustrating the Principle of Superposition, the Principle of Original Horizontality, Cross-cutting Relationships and Unconformities, and Sedimentary Cross-bedding: The following two diagrams illustrate some of the fundamental principles of geological interpretation. The Principle of Superposition (I.) applies primarily to layered sedimentary or volcanic rocks. Where these rocks are relatively un-deformed, one can interpret the relative age of the layers as “older rocks are beneath younger rocks”. The typical depositional sequence of layered rocks with time is illustrated in the diagram (I.). Rock units are numbered sequentially. Unit 1 (in this example) represents crystalline basement rocks upon which the sedimentary layers are deposited. The diagrams show cross-section views – similar to cutting a layer cake in half and viewing the layers from the side.
The principle of Original Horizontality (II.) states that most sedimentary rocks (and some volcanic rocks) are originally deposited in approximately horizontal layers. Therefore, when we see these rocks exposed at the Earth’s surface as dipping layers (II. C.) we can infer that have been deformed (II. B.) and subsequently eroded.
Cross-cutting relationships and unconformities are illustrated in the diagram below (III.). These features, when observed in the geologic record, can be used to help determine the relative time sequence of the deposition or intrusion of rock units and events. In the time sequence shown below (III. A. to F.), the rock units and events are numbered sequentially as follows: A. Layered rock units 2 and 3 were deposited (superposition) on rock unit 1 (crystalline basement); B. A fault (4) offsets the pre-existing layers (a cross-cutting relationship indicating that the fault is younger than the rock units which it offsets); C. Erosion smoothes off the surface resulting in the removal of some of units 2 and 3, and a resulting unconformity (5) – a surface representing a period of time and the loss of some geologic record (and an additional cross-cutting relationship); D. A volcanic eruption occurs on the down-thrown side of the fault resulting in the building of a volcano on the surface and the intrusion of igneous rocks (6) into the older rock units (the intrusion is another cross-cutting unit and therefore is younger than the rock units that it intrudes); E. Further erosion again removes surface rock units (including the volcano) resulting in another unconformity (7) which cuts across rock units; F. Deposition of rock unit 8 on the unconformable surface (7) shows that unit 8 is younger than the rock units below it (superposition) and younger than the intrusion (6) that layer 8 cross-cuts. Using superposition and cross-cutting relationships, a geologist viewing the rock record in diagram III. F. could determine the relative time sequence of all units as illustrated in stages A. to F.
Diagram IV. is a schematic illustration of cross-bedding which is a small scale sedimentary structure that is commonly observed in sandstone and quartzite rock samples (pebbles). Cross-bedding is caused by changing current directions during deposition of sand deposits in rivers, on beaches and in sand dunes.
8. Sample Rubric: A sample rubric (below) is provided as a suggested approach to grading the student materials in the Every Pebble Tells a Story activity.
9. Mineral Key Table – Nonmetallic Minerals: This mineral key table (below) provides additional information for the study of mineral identification of nonmetallic minerals.
10. Mineral Key Table – Metallic Minerals: This mineral key table (below) provides additional information for the study of mineral identification of metallic minerals.
Every Pebble Tells a Story
Sample Rubric
Name________________________________________ Date________________
Content:
Identification of rock type and name ____ (out of 20)
Accuracy of interpreted sequence ____ (10)
Possible timeline ____ (10) ____ (40)
Creativity:
Title ____ (10)
Introduction and conclusion ____ (10)
Use of supporting detail/observations ____ (10)
Interesting to read ____ (10) ____ (40)
Neatness:
Typed, 12 point font or neatly handwritten,
Double spaced ____ (10) ____ (10)
Observation sheet:
Accuracy ____ (5)
Completeness ____ (5) ____ (10)
Total score:______________________ Grade:__________________