Plate Puzzle 1
Larry Braile
http://web.ics.purdue.edu/~braile Sheryl Braile Happy April, 2000 (revised February,
2002; September, 2006) |
|

Objectives: Develop a better understanding of the Earth’s plates and their distribution. Explore plate motions and the interactions of the plates along the plate boundaries. Before beginning this activity, students should have a basic knowledge of the Earth’s plates, the lithosphere and asthenosphere, heat within the Earth, and the three types of plate boundaries – divergent, convergent and transform. Similar activities are contained in Tremor Troop (the FEMA/NSTA earthquake curriculum for grades K-6) on pages 43-44 and 56-60, and on Masters 13, 14a and 14b; and at: http://quake.wr.usgs.gov/research/deformation/modeling/teaching/puzzle/. Good activities to precede this lesson are the foam models of the lithosphere and the epicenter plotting activities. Good follow-up activities are: plate tectonics flip book, epicenter plotting using program Seismic Eruption, earthquake location, and thermal convection (http://web.ics.purdue.edu/~braile; these activities could also be performed before the Plate Puzzle* lesson; in this case, the Plate Puzzle activity is an excellent authentic assessment tool). Note: This is a revised description of this activity due to the release of a new version (2006) of the “This Dynamic Planet” map.
* MS Word and PDF versions of this document are located at:
http://web.ics.purdue.edu/~braile/edumod/platepuzz/platepuzz.doc, and
http://web.ics.purdue.edu/~braile/edumod/platepuzz/platepuzz.pdf.
[1]  Last
modified October 15, 2006
Last
modified October 15, 2006
The web page for
this document is:
http://web.ics.purdue.edu/~braile/edumod/platepuzz/platepuzz.htm
Partial funding for this development provided by the National Science Foundation.
ã Copyright 2000-06. L. Braile. Permission granted for reproduction for non-commercial uses.
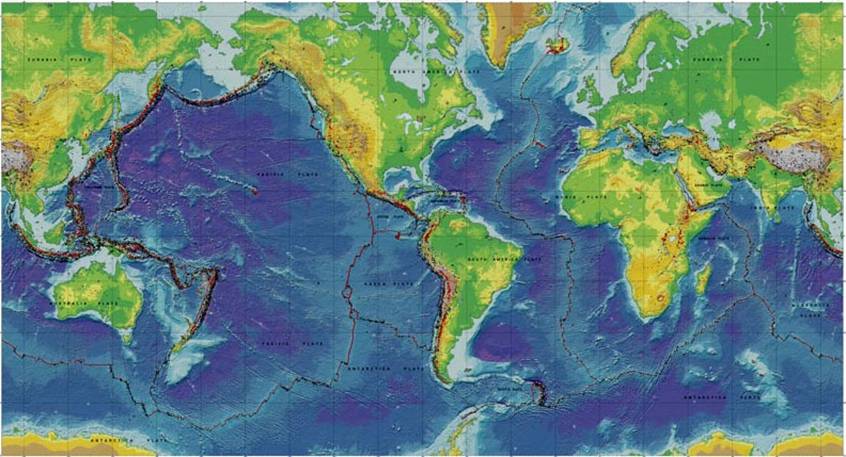
Introduction: The “This Dynamic Planet” map (Figure 1) is an excellent resource for
learning about plate tectonics. The map
is an attractive display of plate tectonic features such earthquake epicenters,
the locations of volcanoes, topography and ocean bathymetry. The map also shows the inferred location of
plate boundaries so that one can examine the relationship of the tectonic
features to the plate boundaries. The
map legend (below the main map) and the back side of the map (Figure 2) display
several smaller maps, diagrams and text that help explain plate tectonics. The map is also available online in an
interactive version (http://www.minerals.si.edu/tdpmap/) that allows one to select data to be
displayed and zoom in to areas of interest for a close-up view (Figures 3, 4
and 5). One can also display close-ups
of the diagrams in the legend and the back side of the map. The legend below the map includes a map of
the plate boundaries (Figure 6) and related legend (Figure 7) and a schematic
diagram illustrating plate tectonic features on the surface and at depth
(Figure 8). Examples of explanatory
material from the back of the map are shown in Figures 9, 10 and 11.
The plate puzzle activity requires cutting a copy of the map into
pieces along the plate boundaries so that students can put it together like a
jigsaw puzzle. The plate boundaries
illustrated in the map in Figure 12 are suggested. An additional plate tectonic map that can be
used to describe the plates is given in Figure 13. Detailed instructions and suggested questions
to use with the plate puzzle activity are provided in the next sections.
Preparation:
- Obtain an extra copy of the map “This Dynamic Planet” (you should have one copy hanging on the wall during the teaching of your Earth science unit). The map (“This Dynamic Planet,” T. Simkin and others, 2006) is available from the U.S. Geological Survey, Information Services, Box 25286, Federal Center, Denver, CO 80225, or by phone at (888) ASK-USGS, $14 + $5 shipping, new product number 206335, and an interactive version of the map and additional downloadable information is available online at: http://www.minerals.si.edu/tdpmap/ (Figures 1 and 2). A companion document, “This Dynamic Earth: The Story of Plate Tectonics,” is also available from the USGS ($7 + $5 shipping) and on the Internet at: http://pubs.usgs.gov/gip/dynamic/dynamic.html.
2. With scissors, trim the white edges and the legend below the map from the map area. Save the legend. Cut strips off the left and right sides of the map at 100°E longitude (some areas of the world are duplicated on both sides of the map).
3. Cut the map into pieces along the plate boundaries (Figure 12). Don’t worry about the details of the boundaries, such as the many small transform faults along the mid-ocean ridges; just make a smooth cut approximately on the plate boundary. When you are finished, you should have the following plates (18 separate pieces of the puzzle):
African Plate (The African plate is defined as two smaller plates, the Nubian and the Somalia plates, Figure 6, on the 2006 “This Dynamic Planet” map; because the plate boundaries between these smaller plates are not very distinct, we suggest cutting along the African plate boundaries as shown in Figure 12)
Antarctic Plate (cut into two pieces, for convenience, along the
Antarctic peninsula just south of the southern tip of
Arabian Plate (includes
Australian Plate (in two pieces because of the map edge at 100°E longitude)
Cocos Plate (southwest of
Eurasian Plate (in two pieces because of the map edge at 100°E longitude)
Indian Plate
Juan de Fuca Plate (west of
Nazca Plate
North American Plate
Pacific Plate
Philippine Plate (west of
Scotia Plate (east of the southern tip of
South American Plate
4. Find the arrows on most of the plates and the white numbers on many of the mid-ocean ridges that indicate the directions and velocities of plate motion. Write the velocity of the plate motion next to the arrows using a black felt pen so that the numbers are more visible. The velocities are given in mm/yr. If you are more familiar with plate motions given in cm/yr, you can write the velocities in cm/yr by “moving the decimal point.” For example, for the Arabian Plate, the velocity is 26 mm/yr or 2.6 cm/yr.
5. Laminate the 18 plate pieces and cut off excess laminating material. Also, laminate the legend –
the strip cut off the bottom of the map – and save for reference.
6. For the discussion of the completed map in the procedure described below, it is convenient to
have the students stand around the map and to use a laser pointer (or a meter stick or other pointer) to point out specific plates, plate boundaries, velocity vectors, or other features.
Procedure:
1. Give one piece of the puzzle (a plate or piece of a plate) to each student or pair of students. Tell them that they will be responsible for their plate – placing it in the right position to form the world map and determining the plate’s motion with respect to surrounding plates. Have the students assemble the map (like putting together a jigsaw puzzle) on the floor or on a large table. An alternative procedure that works well and stimulates thinking and discovery is the following. Give a piece of the puzzle to each student (or team of students). Tell them that these are pieces of a puzzle and that it comes from a world map. Their instructions are to put the puzzle together without talking. They can point to communicate, but the puzzle is to be put together in silence. After the puzzle is completed, the students can be asked about what they think the pieces are and why. Examples of pieces of the puzzle are shown in Figure 14.
2. Note the arrows and velocities (in mm/yr) that indicate the motion of the plates. Some plates do not include arrows. Find the highest and lowest plate velocities. Comment on the speed of the plates; for example, 35 mm/yr or 3.5 cm/yr is equivalent to 35 km/million years. So, the plates are not moving very fast – about the speed that a person’s fingernails grow. What areas of the Earth are associated with the largest plate velocities?
3. Have each student (or pair of students) determine how their plate moves with respect to the surrounding plates. Students should discuss with each other and agree with each other or note their differing interpretations. After a brief time for discussion, ask a few students to explain what their plate’s motion is and how it is interacting with adjacent plates.
4. Find locations on the map that are associated with (Descriptions and illustrations of these plate boundaries are included on the back side of the 2006 “This Dynamic Planet” map and on the plate tectonic schematic diagram in the map legend, Figure 8. Plate boundaries can be illustrated using foam models; http://web.ics.purdue.edu/~braile/edumod/foammod/foammod.htm):
a. convergence; for example: the South
American plate and the Nazca plate, the western
b. divergence; for example: the Mid Atlantic Ridge (note
c. transform [this one is more difficult]; for example: the San
Andreas fault in
Sometimes
the plate motions and interactions are more complicated. For example, for the North American and
Pacific plates, the Pacific plate is moving approximately northwest while the
North American plate is moving approximately southwest. The combination of these motions and the
irregularly shaped plate boundaries results in convergence along the Aleutian
Islands, divergence at the Juan de Fuca ridge and predominately transform
motions along the San Andreas fault and within the
For each of these examples, move the appropriate plates a small amount in the direction of the arrows to see what the plate interactions will be. Question about or comment on the features that are associated with the plate boundaries – earthquakes, mountain ranges, deep sea trenches, volcanoes. For this and other parts of the activity, it is convenient for the class to stand around the map and to use a laser pointer or a meter stick to point our individual plates or plate boundaries.
To better view the correlation of earthquake and volcanic activity along plate boundaries and to display the plate names and distribution, Figures 15 and 16 can be made into color or black and white transparencies. The transparency from Figure 16 can be overlain on the transparency from Figure 15 to show that the pattern of earthquake epicenters delineates the plates.
Examples of the plate boundaries and further information and illustrations of plate tectonics and continental drift can be found in the USGS publication "This Dynamic Earth" and in the video by T.A. Atwater (1988). These materials provide excellent color illustrations to supplement the Plate Puzzle activity.
5. Questions to generate discussion:
a. Explain
why the Australian continent has few earthquakes. However, note that there are very active
earthquake zones near
b. What is the cause of the
c. Compare the earthquake
activity, volcanic activity and topography of the west and east coasts of
d. What happens when the plates
move apart at the mid-ocean ridges? Note
http://www.ngdc.noaa.gov/mgg/announcements/images_predict.HTML, or a color map of the ages of the ocean crust at: http://gdcinfo.agg.emr.ca/app/app3_e.html.
e. What do you think is
happening in east
f. Can you find areas representing different stages of continental separation (continental rifting, initial ocean crust formation, full ocean basins separating two continental areas)?
g. What direction do you think
that the
h. What direction do you think the Juan de Fuca plate is moving? How do you know?
i. Note the
j. The “This Dynamic Planet” map is a Mercator projection so the geographic features (plates, continents, etc.) are somewhat distorted, particularly in the high-latitude areas of the world. To examine this distortion and obtain a better visual image of what the plates look like, compare the outlines of the continents on the Mercator projection with the outlines on a globe.
Connections to National Science Education Standards (National Research Council, 1996, http://www.nap.edu/readingroom/books/nses/html/): Teaching Standards: inquiry-based (A,B); opportunity for assessment (C). Professional Development Standards: opportunity for learning new Earth science content (A,C); suggestions for effective teaching strategies (B). Assessment Standards: authentic assessment (C). Content Standards: Science as Inquiry – practice inquiry and fundamental science skills (grades 5-8 and 9-12, A); Physical Science – properties of matter (grades K-4, 5-8, B), structure and properties of matter (grades 9-12, B); Earth and Space Science – properties of Earth materials (grades K-4, D), structure of the Earth system (grades 5-8, D), geochemical cycles, origin and evolution of the Earth system (grades 9-12, D).
Acknowledgements: We are
grateful to John Lahr who first suggested to us using the “This Dynamic Planet”
map for the Plate Puzzle. That clever suggestion
resulted in the development of this activity that has become a favorite of many
educators interested in teaching about plate tectonics, plate motions and the
relationship of plate tectonics to earthquakes and volcanic activity.
References:
Atwater, Tanya, Continental Drift and Plate Tectonics Video, 20 minute videotape, 1988, (obtain from Rick Johnson, Instructional Consultation, UC-Santa Barbara, Santa Barbara, CA 93106, $15, make check payable to "Regents of the University of California.")
National Science Teachers Association, Tremor Troop
– Earthquakes: A teacher's package
for K-6
grades, NSTA Publications,
reasonably complete curriculum for teaching earthquakes and related Earth science topics;
FEMA
159, for free copy, write on school letterhead to: FEMA,
20024; FEMA 159, Revised Edition, August, 2000, available from FEMA Publication
Warehouse, 1-800-480-2520).
Simkin, Tom, Robert I. Tilling, Peter R. Vogt, Stephen H. Kirby, Paul Kimberly, and David B. Stewart, This Dynamic Planet – World Map of Volcanoes, Earthquakes, Impact Craters, and Plate Tectonics, Smithsonian Institution and U.S. Geological Survey, 2006.
U.S. Geological Survey, This Dynamic Earth: The Story of Plate Tectonics, available from: U.S. Geol. Survey, Map Distribution, Federal Center, PO Box 25286, Denver, CO 80225, $7 + $5 shipping, (1-888 ASK-USGS).
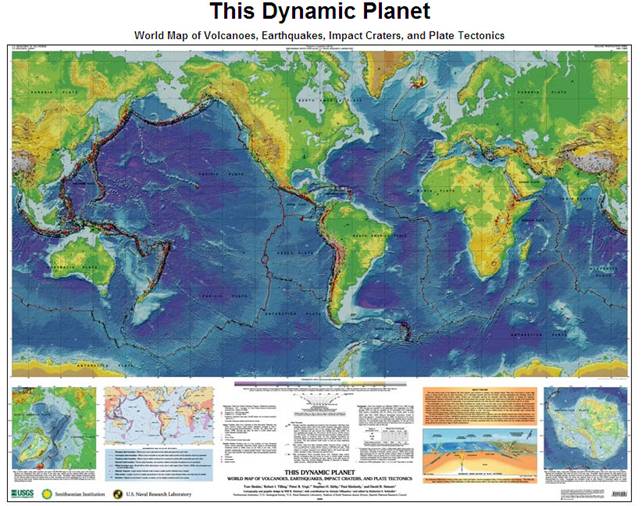
Figure 1. Reduced size image of
2006 "This Dynamic Planet" map (map size is ~150 x 100 cm, including
legend, 1:30,000,000 scale at the equator), compiled by Tom Simkin, Robert I.
Tilling, Peter R. Vogt, Stephen H. Kirby, Paul Kimberly, and David B. Stewart. Cartography by Will R. Stettner. From the website: http://www.minerals.si.edu/tdpmap/.
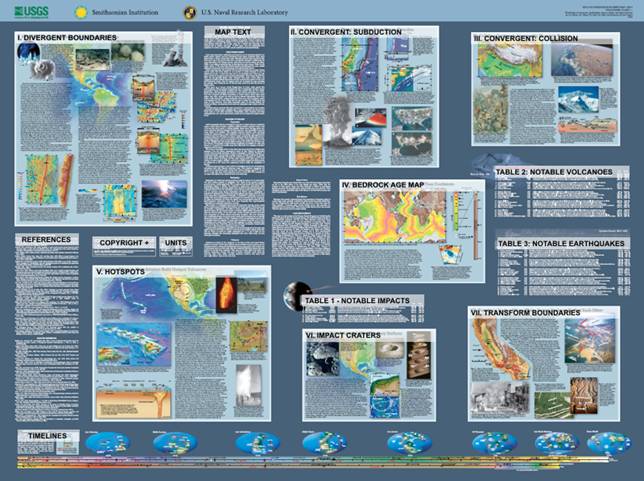
Figure 2. Reduced size image of
back side of the 2006 "This Dynamic Planet" map. Information on plate boundaries, hotspots,
notable volcanoes, earthquakes and impacts, and references is provided. This information can be viewed interactively
to zoom in on the features at the website (http://www.minerals.si.edu/tdpmap/).
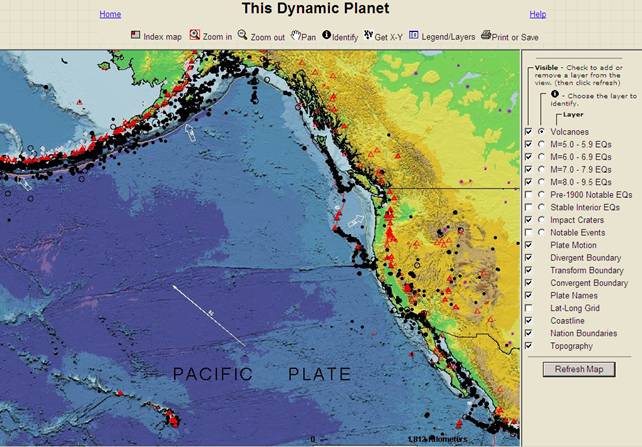
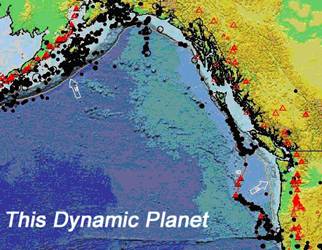
Figure 3. Close-up view of the northeast Pacific plate
region and northwestern
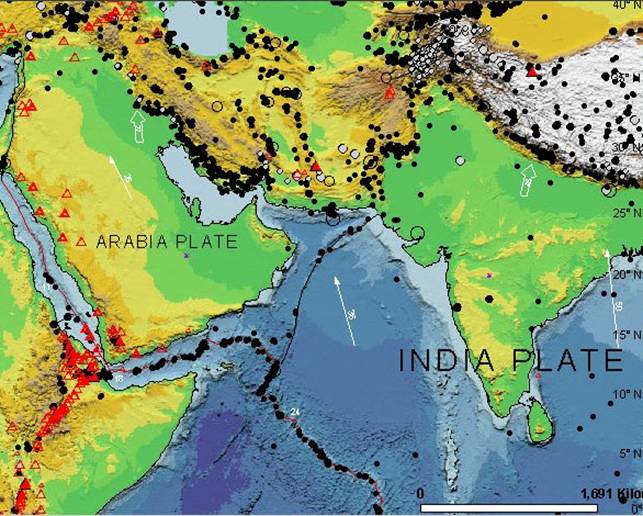
Figure 4. Example (Indian Plate
and surrounding area) of the earthquake, topography, volcano, plate motion and
geographic data shown on the "This Dynamic Planet" map (from the
interactive website with all earthquakes selected, http://www.minerals.si.edu/tdpmap/). Dots
are earthquake epicenters. Red triangles
are volcanoes. Arrows indicate direction
of plate motion. Numbers next to the
arrows show plate velocity in mm/yr.
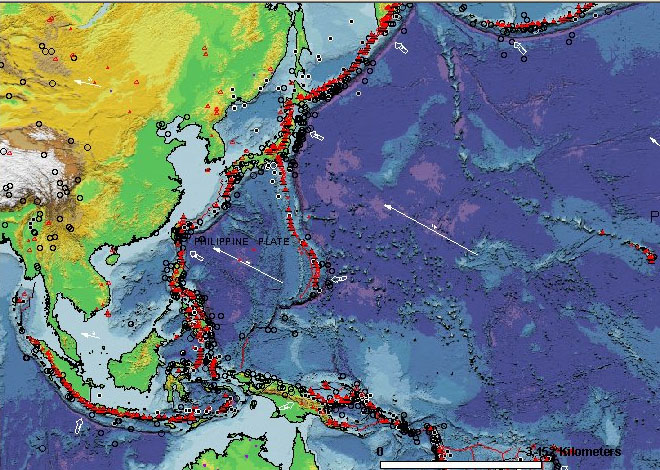
Figure 5. Example (Western Pacific area) of the
earthquake, topography, volcano, plate motion and geographic data shown on the
"This Dynamic Planet" map (from the interactive website with all
earthquakes selected, http://www.minerals.si.edu/tdpmap/).
Dots are earthquake epicenters.
Red triangles are volcanoes.
Arrows indicate direction of plate motion. Numbers next to the arrows show plate
velocity in mm/yr.
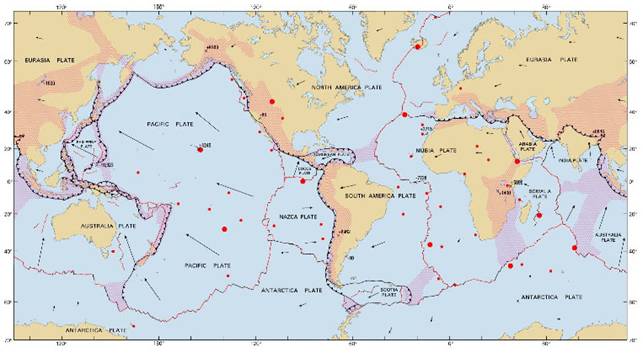
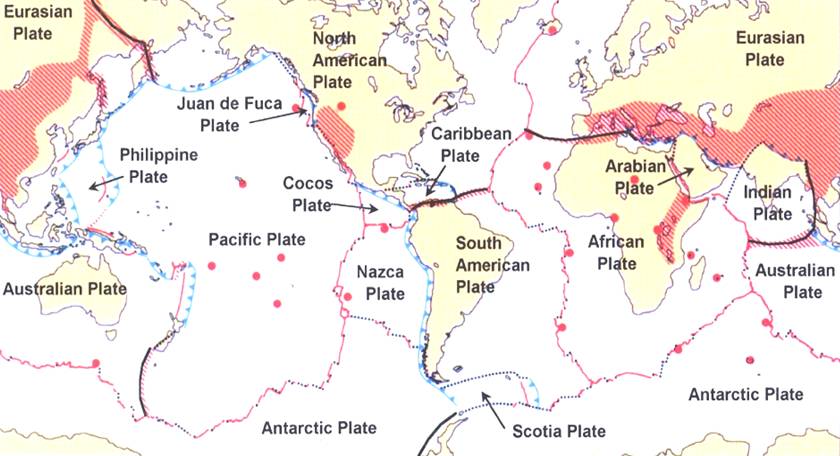
Figure 6. Plate boundaries from the 2006 “This Dynamic
Planet” map.
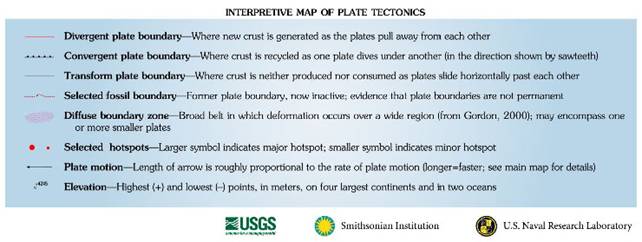
Figure 7. Legend for plate boundaries (Figure 6).
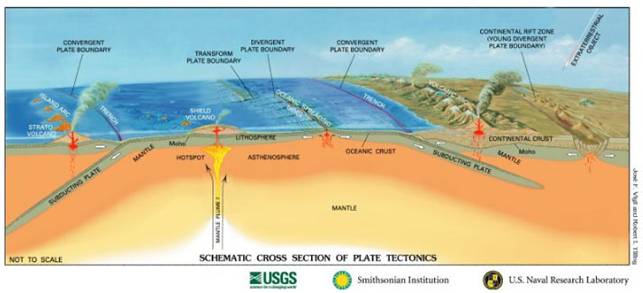
Figure 8. Schematic diagram illustrating plate
tectonics (from the 2006 “This Dynamic Planet” map).
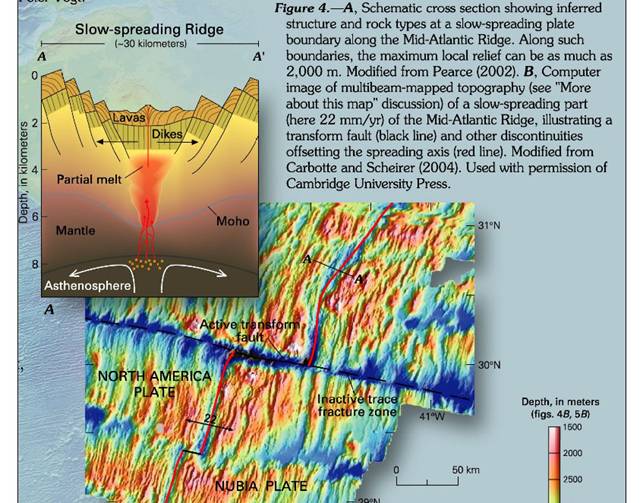
Figure 9. Close-up of diagrams illustrating divergent
boundaries from the back of the “This Dynamic Planet” map.
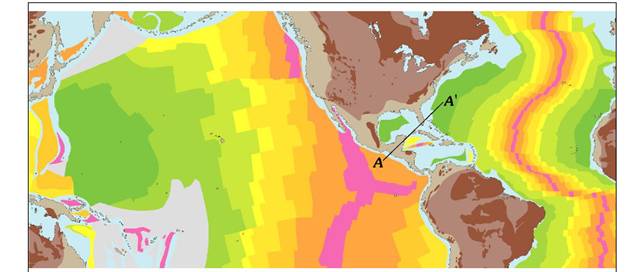
Figure 10. Crustal age map
from the back of the “This Dynamic Planet” map.
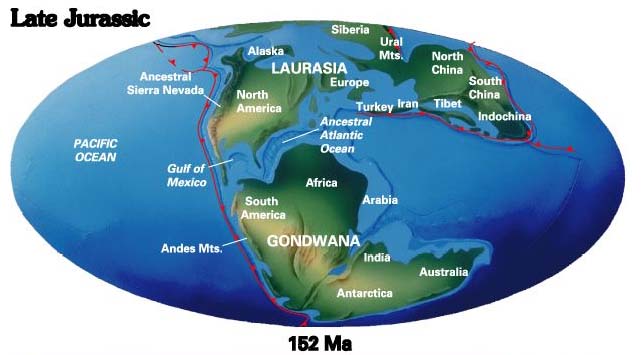
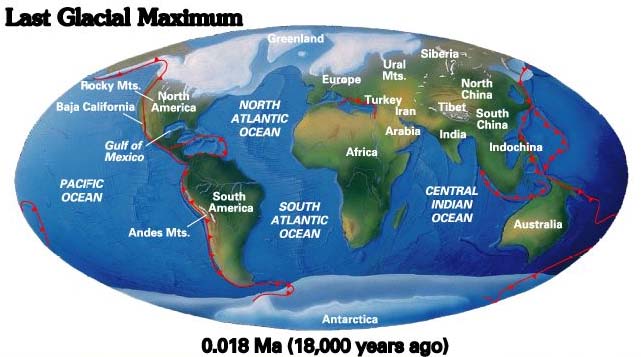
Figure 11. Plate reconstruction maps (152 Ma, upper and
0.018Ma, lower) from the back of the “This Dynamic Planet” map.
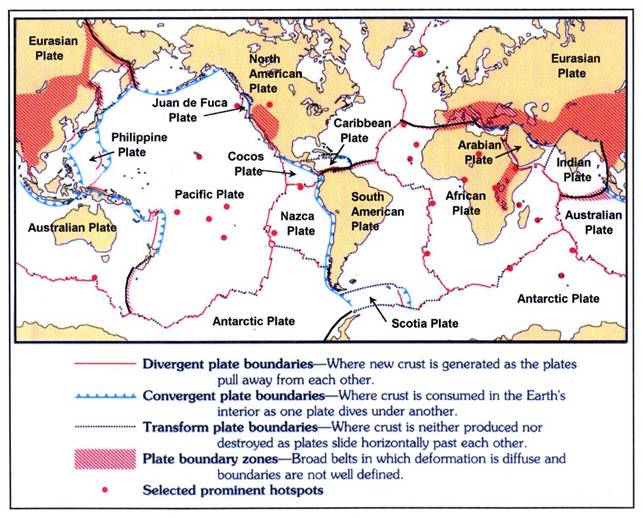
Figure 12. Map of plate boundaries and plate names
(modified from the 1996 legend of the “This Dynamic Planet” map). For the plate puzzle activity, cut along
boundaries (divergent, convergent and transform boundaries) and along the
"plate boundary zones" (diagonal shaded areas) that are marked with a
bold line. Cut the Antarctic plate along
the bold line to the southwest of the
Figure 13. Color map of the Earth’s tectonic plates (http://geology.er.usgs.gov/eastern/plates.html).
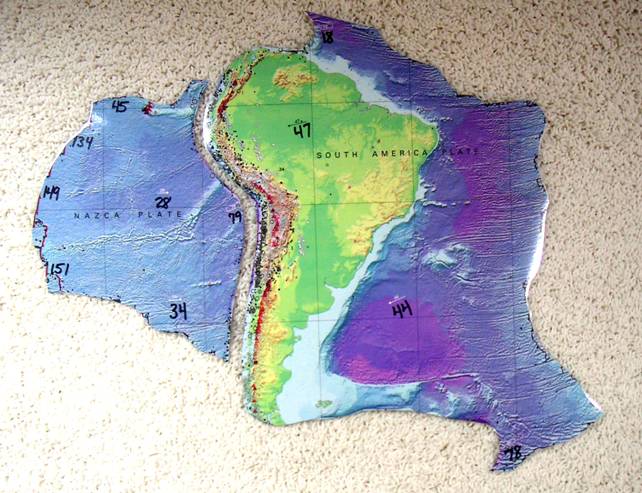
Figure 14. Two pieces of the plate puzzle. Numbers are interpreted plate velocities in
mm/yr. Arrows show directions of plate
motion. Students should be able to
describe the motion of their piece of the puzzle relative to adjacent pieces
(plates or parts of plates), identify what type of plate boundary is involved
(divergent, convergent or transform) and describe the features (trenches,
earthquakes and volcanoes, mountain rages, etc.) that are associated with each
boundary represented by their plate.